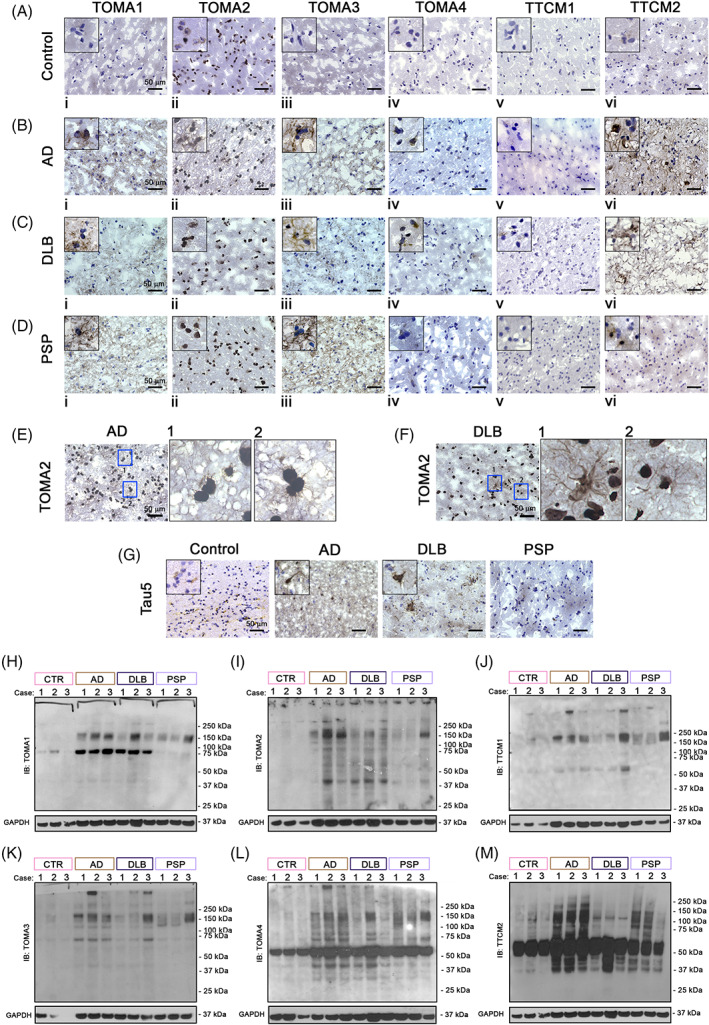
FIGURE 8.

Differential tau oligomeric patterns in AD, DLB and PSP brain homogenates. Immunohistochemistry of Ctr (A), AD (B), DLB (C) and PSP (D) brain cortical sections with TOMA1, TOMA2, TOMA3, TOMA4, TTC‐M1, TTC‐M2 abs. Magnification 40×, black scale bar 50 μm. Top left of each image represent an inset 20× zoomed from the original frame. (E) TOMA2 IHC in AD brains, magnification 40×, black scale bar 50 μm, blue boxes are represented with 20× zoomed inset 1 and 2. (F) TOMA2 IHC in DLB brains, magnification 40×, black scale bar 50 μm, blue boxes are represented with 20× zoomed inset 1 and 2. Western blot analyses of AD, DLB and PSP brain homogenates (G) Tau5 IHC in Ctr, AD, DLB, PSP cortical sections. Magnification 40×, black scale bar 50 μm. Top left of each image represent an inset 20× zoomed from the original frame. (H) TOMA1 IB in brain homogenates of Ctr, AD, DLB and PSP cortices. (I) TOMA2 IB in brain homogenates of Ctr, AD, DLB and PSP cortices. (J) TTC‐M1 IB in brain homogenates of Ctr, AD, DLB and PSP cortices. (K) TOMA3 IB in brain homogenates of Ctr, AD, DLB and PSP cortices. (L) TOMA4 IB in brain homogenates of Ctr, AD, DLB and PSP cortices. (M) TTC‐M2 IB in brain homogenates of Ctr, AD, DLB and PSP cortices
