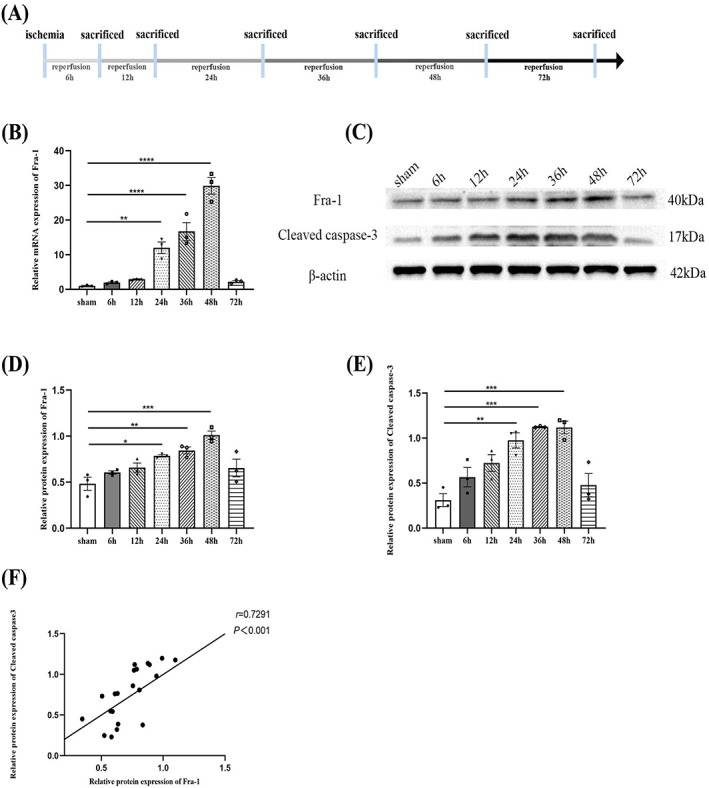
FIGURE 1.

The expression of Fra‐1 at different time points after spinal ischemia/reperfusion (I/R). (A) Schematic of the experimental design shows the timeline for grouping rats. At different time points (6, 12, 24, 36, 48 and 72 h) after I/R induction, the L4‐L6 segments of spinal cords were harvested from the rats. (B) qRT‐PCR‐assisted detection of the relative mRNA level of Fra‐1 after I/R (n = 3 rats/group). (C–E) Western blot‐assisted analysis of the protein expression levels of Fra‐1 and cleaved caspase‐3 after I/R (n = 3 rats/group). (F) Correlation analysis of Fra‐1 and cleaved caspase‐3 protein expression levels. All data represent the mean ± SEM. *p < 0.05, **p < 0.01, ***p < 0.001, ****p < 0.0001.
