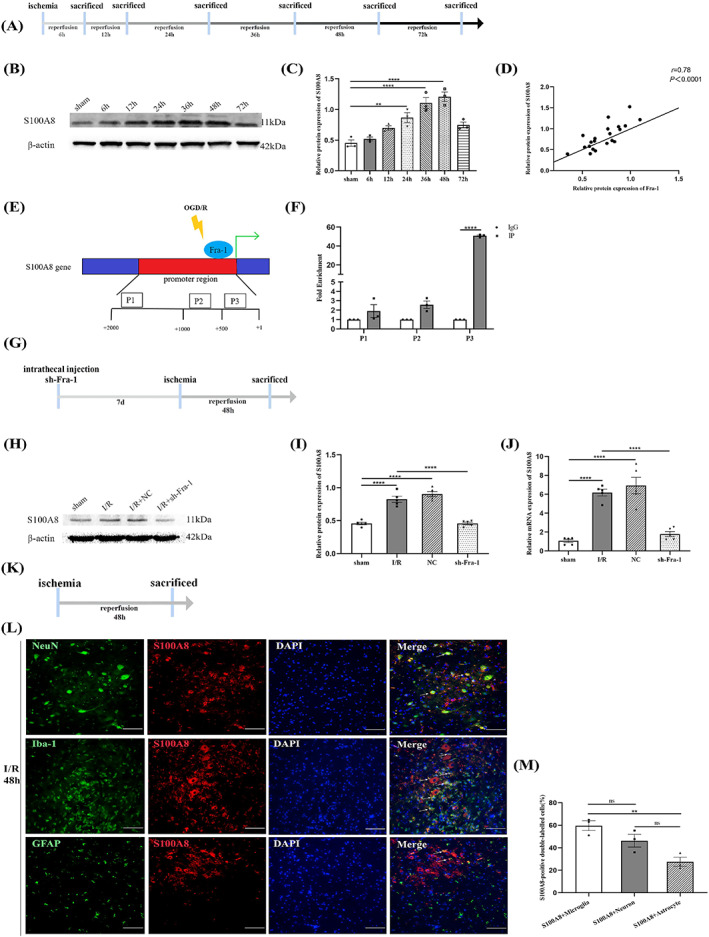
FIGURE 5.

S100A8 is a direct target of Fra‐1. (A) Schematic of the experimental design shows the timeline for grouping rats. At different time points (6, 12, 24, 36, 48, and 72 h) after I/R induction, tissue samples were collected. (B,C) Western blot‐assisted analysis and quantification of S100A8 at different time points after I/R (n = 3 rats/group). (D) Correlation analysis of Fra‐1 and S100A8 protein expression. (E) We selected three putative Fra‐1 binding sites of the S100A8 promoter (P1–P3). (F) ChIP‐qPCR‐assisted analysis of S100A8 promoter fragments containing the binding site for Fra‐1. (G) The rats were intrathecally injected sh‐Fra‐1 7 days before I/R induction. After 48 h of I/R, tissue samples were collected. (H,I) Western blot‐assisted analysis and quantification of S100A8 protein expression after intrathecal injection of sh‐Fra‐1 (n = 5 rats/group). (J) qRT‐PCR‐assisted detection of the relative mRNA level of S100A8 in rat spinal cord samples (n = 5 rats/group). (K) Spinal cord ischemia model was established. After 48 h of I/R, tissue samples were collected. (L) In the ventral horn of the spinal cord, the distribution and expression of S100A8 (red) were detected by double immunofluorescence (IF) analysis with NeuN (green, neuron marker), Iba‐1 (green, microglial marker) and GFAP (green, astrocyte marker) after I/R (n = 3 rats/group). Scale bar = 100 μm. (M) Quantified S100A8‐positive double‐labeled neurons, microglia and astrocytes in the spinal cord after I/R. All data represent the mean ± SEM. **p < 0.01, ****p < 0.0001, ns, not significant.
