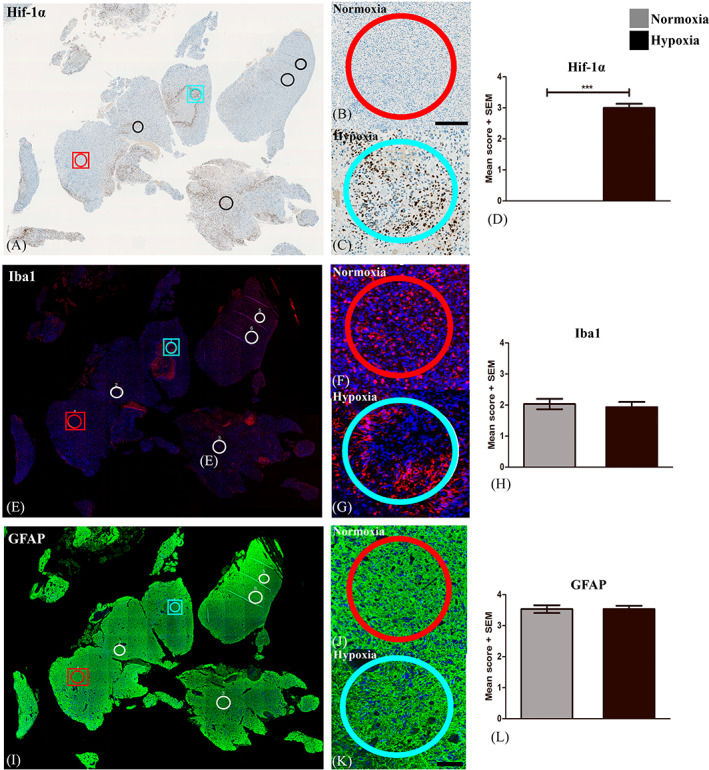
FIGURE 1.

Selection of Regions of interest (ROIs). (A) ROIs were outlined in areas with no or high Hif‐1α expression and defined as (B) normoxic and (C) hypoxic ROIs, respectively. Double immunofluorescence staining with Iba1 and GFAP ensured the presence of (E‐G) tumor‐associated microglia and macrophages and (I‐K) tumor cells, respectively. The expression of each marker was scored and (D) Hif‐1α was significantly higher expressed in hypoxic ROIs as compared to normoxic, whereas (H) Iba1 and (L) GFAP was expressed equally in normoxia and hypoxia. Statistical significance was defined as *p < 0.5, **p < 0.01, ***p < 0.001. Abbreviations: Hypoxia‐inducible factor 1α (Hif‐1α), glial fibrillary acidic protein (GFAP), ionized calciumbinding adapter molecule 1 (Iba1).
