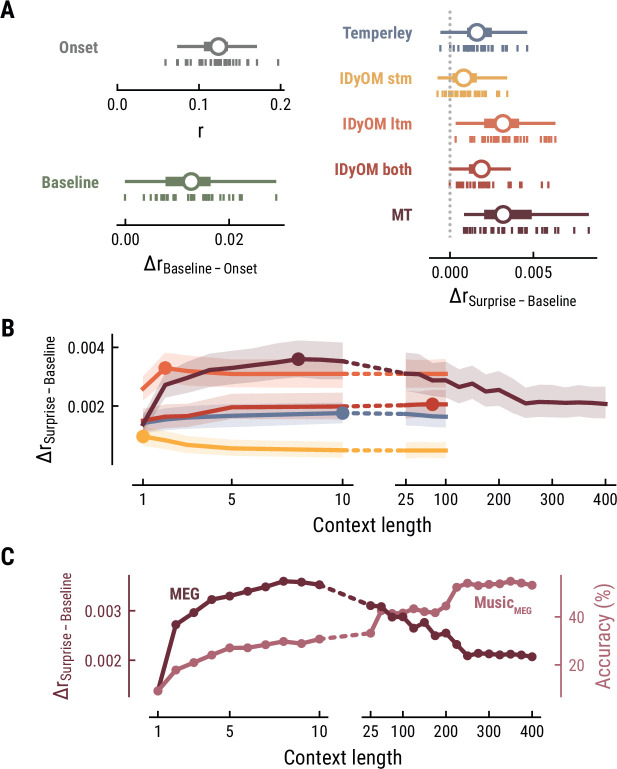
Figure 3. Model performance on MEG data from 35 listeners.
(A) Cross-validated r for the Onset only model (top left). Difference in cross-validated r between the Baseline model including acoustic regressors and the Onset model (bottom left). Difference in cross-validated r between models including surprise estimates from different model classes (color-coded) and the Baseline model (right). Vertical bars: participants; box plot as in Figure 2. (B) Comparison between the best surprise models from each model class as a function of context length. Lines: mean across participants, shaded area: 95% CI. (C) Predictive performance of the Music Transformer (MT) on the MEG data (left y-axis, dark, mean across participants) and the music data from the MEG study (right y-axis, light, median across compositions).

