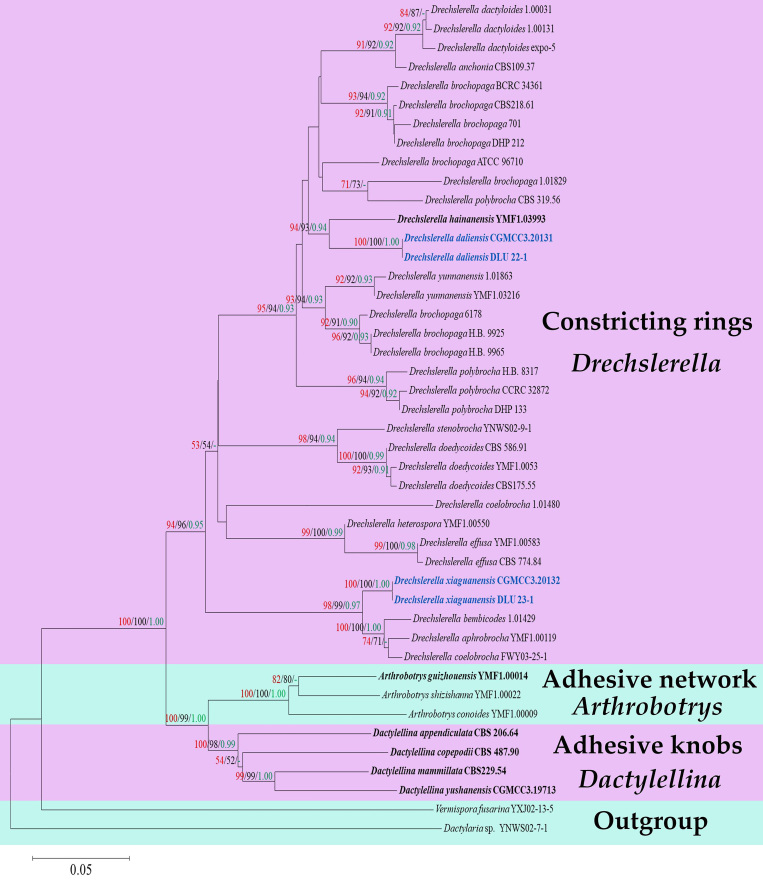
Figure 3.
Maximum Likelihood tree, based on combined ITS, TEF1-α and RPB2 sequence data from 42 nematode-trapping taxa in Orbiliaceae. Bootstrap support values for Maximum Parsimony (red) and Maximum Likelihood (black) equal or greater than 50% and Bayesian posterior probabilities values (green) greater than 0.90 are indicated above the nodes. New isolates are in blue, ex-type strains are in bold.

