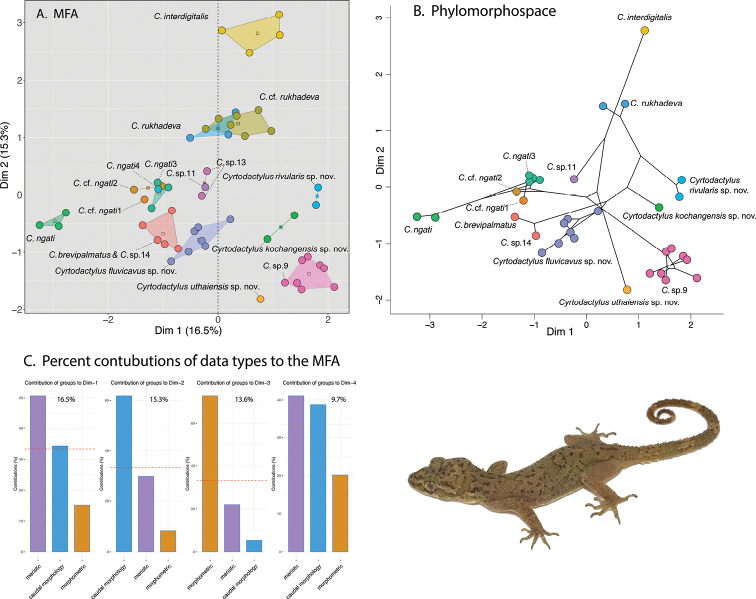
Figure 3.
AMFA of the species-level lineages based on the BEAST phylogeny (Fig. 2) B phylomorphospace projection of the BEAST phylogeny C percent contribution of each data type to Dim 1–4 of the MFA. The percentage score at the top of each graph is the percent contribution of that dimension to the overall variation in the data set.

