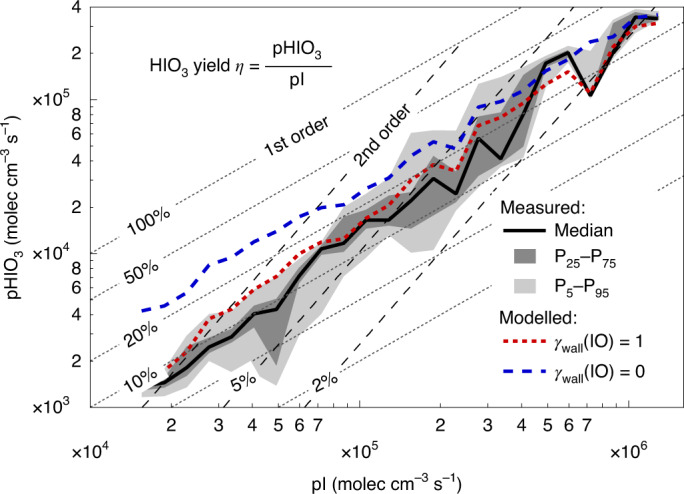
Fig. 2. HIO3 yield η and rate order.

The HIO3 production rate pHIO3 scales in first order with the I atom production rate pI (median (solid line) and 25–75% and 5–95% inter-percentile ranges (dark and light grey shading)). The yield η is substantial (~20%) and near constant for pI larger than 105 molec cm−3 s−1. At smaller pI, losses of intermediates to chamber walls reduce η. This effect is captured by the model (red line (median)) and is explained by IO radical wall losses (compare blue dashed and red dotted lines (medians)). If larger IxOy clusters were the HIO3 precursor, a higher-order yield would be expected—this is not consistent with the observations.
