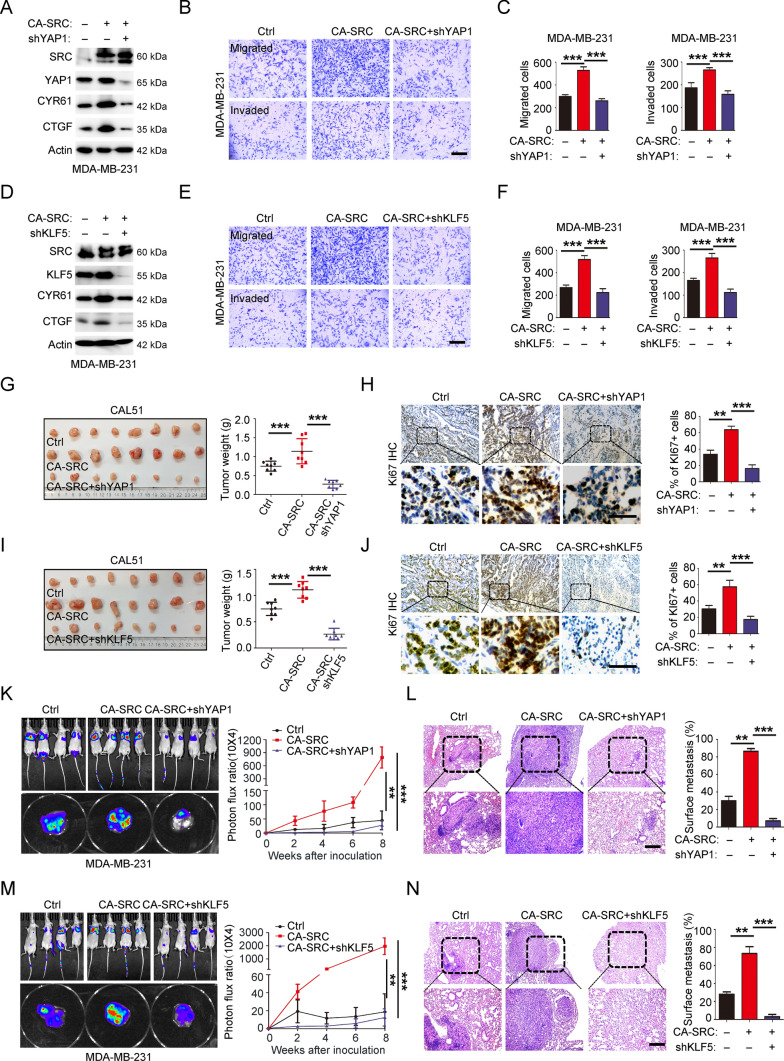
Fig. 5.
YAP1-KLF5 oncogenic module is responsible for SRC-enhanced CSC-like properties, cell growth and migration/invasion behaviors. A Western blot analyses of total proteins from MDA-MB-231 cells stably expressing Ctrl, CA-SRC or CA-SRC + shYAP1 using the indicated antibodies. B–C In vitro cell migration/invasion ability was measured in MDA-MB-231 cells stably expressing Ctrl, CA-SRC or CA-SRC + shYAP1 using the Transwell chamber or Transwell chamber containing the Matrigel as barrier. Representative images of migrated cells were shown. Scale bars = 100 μm. The quantitation data represent means ± SD with 3 biological replicates. D Western blot analyses of total proteins from MDA-MB-231 cells stably expressing Ctrl, CA-SRC or CA-SRC + shKLF5 using the indicated antibodies. E–F In vitro cell migration/invasion ability was measured in MDA-MB-231 cells stably expressing Ctrl, CA-SRC or CA-SRC + shKLF5 using the Transwell chamber or Transwell chamber containing the Matrigel as barrier. Representative images of migrated cells were shown. Scale bars = 100 μm. The quantitation data represent means ± SD with 3 biological replicates. G–J Xenograft tumor formation assays in NOD-SCID mice using CAL51 cells stably expressing Ctrl, CA-SRC or CA-SRC + shYAP1 or shKLF5. Quantitation of tumor weight represent means ± SD with n = 8. Representative images for Ki67 IHC and quantitation data were shown with means ± SD. Scale bars = 100 μm. K–N Bioluminescence images of lung-colonized tumor cells injected through the tail vein using NOD/SCID mice at the tenth week (n = 6 per group), the quantification data was based on the bioluminescence signal intensities and represent means ± SD. HE staining of sections from lung nodules and the quantification data represent the relative area of lung nodules. n = 6. Scale bar = 100 µm

