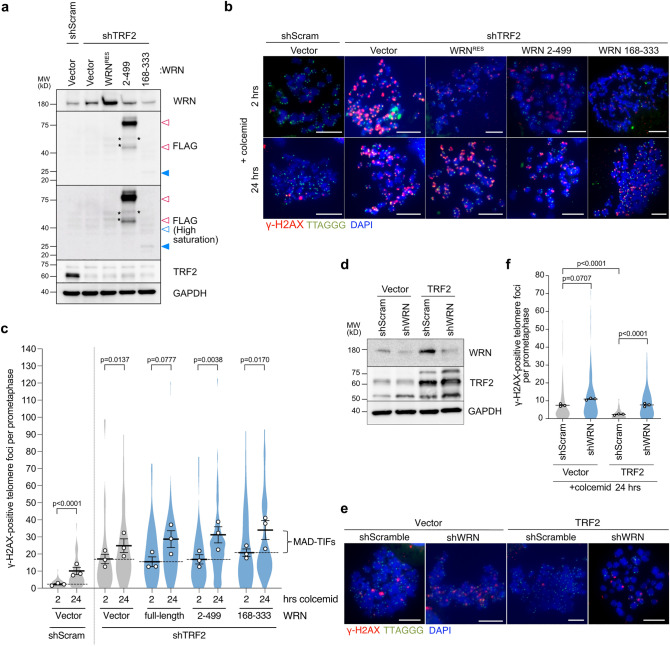
Figure 4.
WRN supports TRF2 function to protect mitotic telomeres. (a) Immunoblot of endogenous WRN, FLAG-WRN fragments, and TRF2 upon TRF2 depletion in indicated cells. IMR-90 E6E7 hTERT cells expressing indicated WRN fragments were transduced with shTRF2 lentivirus and analyzed on day 7 post-infection. Blue-colored arrowhead indicates the expected size for WRN168–333 (~ 27 kDa). White arrowheads (magenta line border for WRN2–499 fragment and blue border for WRN168–333) indicate possible post-translational modifications or complex formation. GAPDH serves as a loading control. (b) Representative images of meta-TIF assay from TRF2 knockdown cells expressing indicated WRN fragments after treatment with 100 ng/ml colcemid. The images show DAPI (blue), γ-H2AX (red), and telomere FISH (green). Scale bar, 10 µm. (c) Quantification of telomeric signals colocalized with γ-H2AX foci in indicated conditions as shown in Fig. 1c (n = 15/experiment for 2 h colcemid; n = 30/experiment for 24 h colcemid; mean ± s.e.m.; Mann–Whitney test). Dashed lines discriminate between the average number of TIFs generated in the interphase due to shTRF2 (2 h colcemid) and MAD-TIFs caused by mitotic arrest (24 h colcemid). (d) Immunoblot of endogenous WRN and TRF2 in indicated cells. IMR-90 E6E7 hTERT cells expressing exogenous TRF2 were transduced with shWRN lentivirus and analyzed on day 5 post-infection. GAPDH serves as a loading control. (e) Representative images of meta-TIF assay in indicated cells from d after treatment with 100 ng/ml colcemid for 24 h. The images show DAPI (blue), γ-H2AX (red), and telomere FISH (green). Scale bar, 10 µm. (f) Quantification of telomeric signals colocalized with γ-H2AX foci in indicated conditions as shown in Fig. 1c (n = 30/experiment; mean ± s.e.m.; Kruskal–Wallis followed by Dunn's test). Unprocessed blot images are shown in Supplementary Information files.

