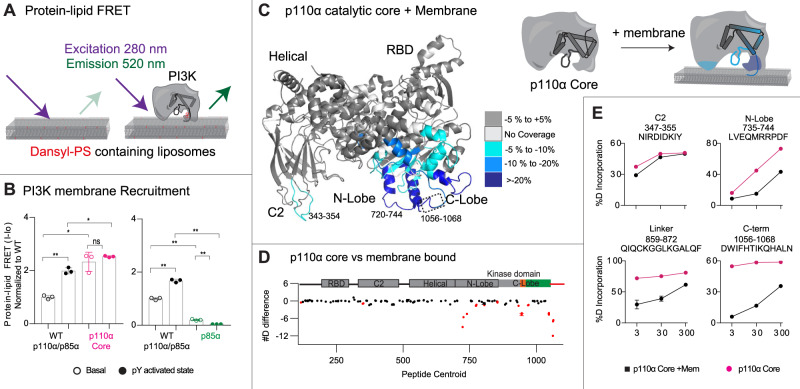
Fig. 3. Enhanced membrane binding of p110α core compared to full-length p110α/p85α, and mapping of the p110α membrane binding interface.
A Cartoon schematic describing the protein-lipid FRET assay, where tryptophan’s in the protein are excited at 280 nm, with emission at 350 nm, which upon membrane binding can excite the dansyl moiety in dansyl phosphatidylserine lipids, leading to emission at 520 nm. B Protein-lipid FRET measurements of membrane recruitment comparing p110α core and full-length p110α/p85α complex as well as full-length p110α/p85α complex and p85a apo under basal and pY activated conditions on PE/PS/PIP2 liposomes containing 5% brain PIP2, 65% egg yolk PE, 25% brain PS and 10% Dansyl-PS (error bars are S.D., n = 3). Experiments were carried out with 1 µM pY, 0.5 µM PI3K and 16.65 µg lipid vesicles. The values were normalised to WT apo. Two-tailed t-test p-values represented by the symbols as follows: **<0.001; *<0.05; n.s.>0.05. C Peptides in p110α core that showed significant differences in HDX (>0.4 Da and 5% difference, with a two-tailed t-test p < 0.01) upon binding to 5% PIP2/PS/PE vesicles were mapped onto the catalytic core of p110α (PDB: 3HHM) according to the legend. D The sum of the number of deuteron difference for all peptides analysed over the entire deuterium exchange time course for p110α core upon binding membranes. Peptides coloured in red are those that had a significant change (>0.4 Da and 5% difference at any timepoint, with a two-tailed t-test p < 0.01). Each point represents a single peptide, and error bars are shown as the sum of S.D. across all time points (n = 3 for each time point). A more complete set of peptides comparing the full-length p110α-p85α with p110α core are shown in Supplementary Fig.4, with the full list of all peptides and their deuterium incorporation in the source data file. E Selected p110α peptides in the kinase domain that showed decreases in exchange in the p110α core upon binding membranes. (Mean is shown, with error bars representing S.D., n = 3). Source data for this figure are provided in the Source Data file.

