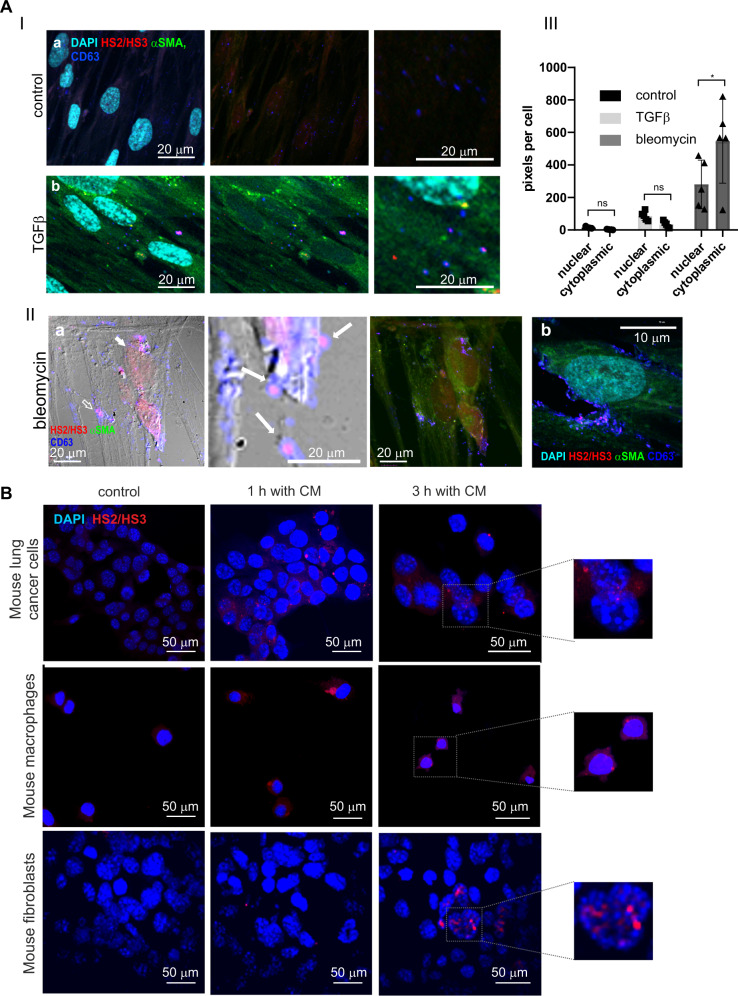
Fig. 3. Extracellular localization of HS2/HS3 satellite transcripts in activated human lung fibroblasts and human HS2/HS3 transfer to mouse cells.
A Panel I. HS2/HS3 transcription in serum-starved HFL1 fibroblasts left untreated (a) or after treatment for 4 d with 20 ng/ml TGFβ1 (b). Fixed fibroblasts were co-stained with HS2/HS3 probe (red), anti-αSMA antibodies (green) and CD63 (extracellular vesicles marker, blue). The nuclei are counterstained with DAPI (turquoise). Right image - intracellular CD63+ vesicles at higher magnification. Scale bars (20 μm) are shown in the images. Total magnification – x400. The results of immuno-FISH quantification of ≥12 fields are shown in the graph. Panel II. HS2/HS3 transcription (red) in serum-starved HFL1 fibroblasts after treatment with bleomycin. Cells were co-stained with anti-αSMA (green) and anti-CD63 (blue) antibodies. (a) cells with the intranuclear-cytoplasmic pattern of HS2/HS3 transcripts distribution; (b) A cell with cytoplasmic pattern of HS2/HS3 transcripts distribution. The nuclei are counterstained by DAPI (turquoise). Scale bars—(Ia) 20 µm, (IIb)—10 µm. Total magnification – x400. Panel III. The FISH images (5 randomized fields with cell number ≥150 in each of them) were quantified (see Supplemental material and methods, Microscopy section) to access the ratio between nucleoplasmic and cytoplasmic signals. The number of pixels occupied by FISH signals in cytoplasm and nuclei was calculated and plotted on the Y-axis Mean and standard deviations are plotted along with the individual values used for calculations. ns—non-significant (p > 0.05), *p < 0.05. B Mouse lung cancer cells, mouse BMD macrophages and MEF cells were serum-starved for 2 d and left untreated (control) or treated for 1 h or 3 h with conditioned media collected from bleomycin-treated serum-starved human HFL1 cells. Human HS2/HS3 transcripts were visualized by DNA-RNA FISH with DYZ probe (red). Representative images (in dotted rectangles) of cells after 3 h treatment are shown at higher magnification for better presentation of human HS2/HS3 intranuclear signals in mouse cells. For each panel a representative image of no less than 10 scanned areas is shown. The nuclei are counterstained by DAPI (blue). Scale bars 50 µm.

