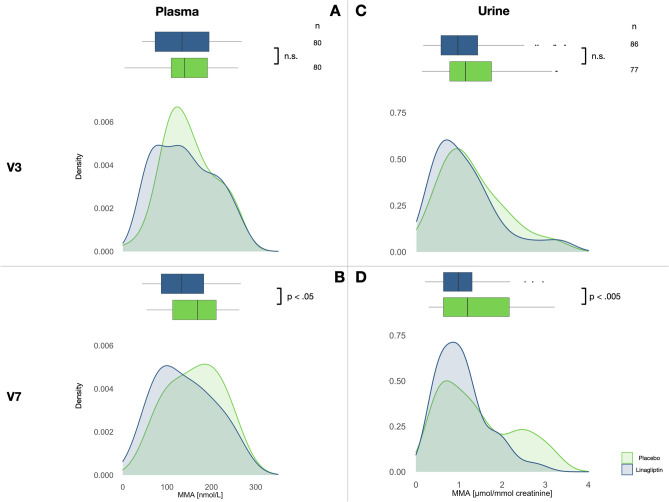
Figure 2.
Distribution of MMA values in plasma and urine at V3 and V7 in individuals with medium MMA levels in dependence of treatment. MMA values for plasma (nmol/L, left, A and B) and urine samples (µmol/mmol creatine, right, C and D) for placebo (green) and linagliptin (blue) at V3 (top, A and C), and V7 (bottom, B and D). The number of samples in each group is shown at the top right. Statistically significant differences between placebo and linagliptin are indicated (Welch t-test). Data is shown as a box-and-whisker plot and the corresponding kernel density estimation. The data shows a shift of MMA values at V7 to the right (towards higher MMA values) in the Placebo group. The shift is also depicted in median and mean values shown in Tables 5 and 6, respectively. MMA, methylmalonic acid; n.s., not significant; V3, baseline; V7, end of study.

