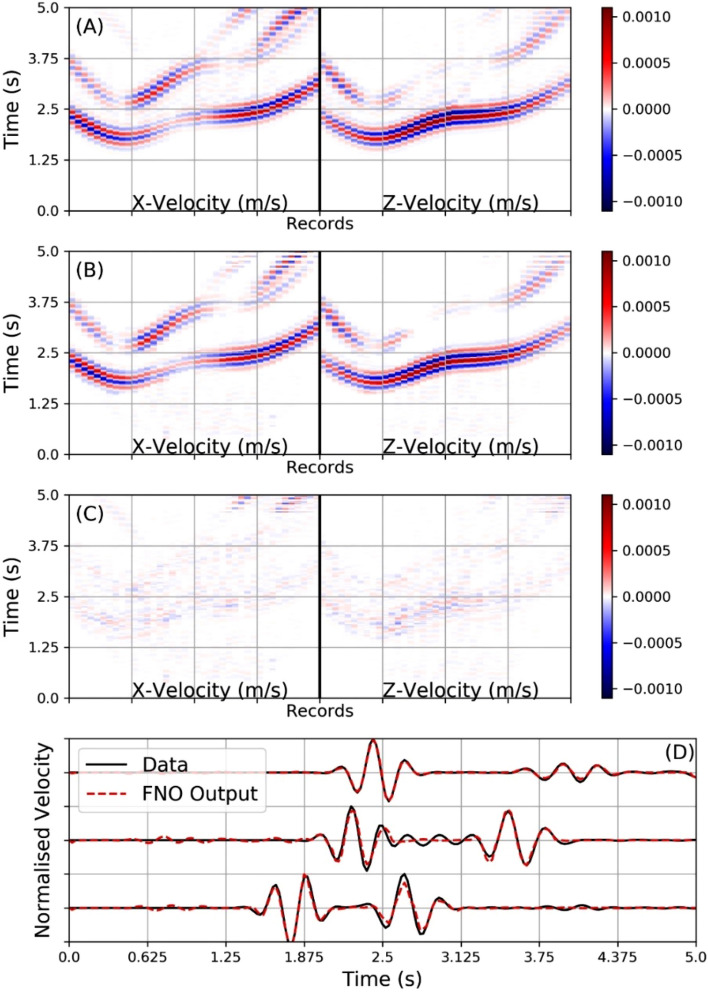
Figure 5.
The top panel (A) shows the results from a numerical simulation directly solving the elastic wave equation with a previously unseen sample model from population L. Panel (B) shows the seismogram prediction results from the FNO network (previously trained with surface seismic data only) when presented with the same layered model as in panel (A). Panel (C) show the difference between the simulation traces and the predicted FNO network outputs. Again the overall match is very good with all main arrivals captured. There are some discrepancies associated with small amplitude scattering. Some edge artefacts from the training set-up can also be observed. The bottom panel (D) shows three simulated traces compared against the FNO predictions, demonstrating a very good match in the main.

