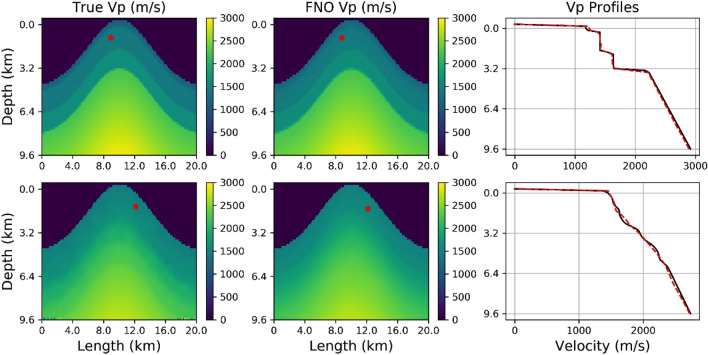
Figure 6.
Left panels, the true unseen models velocity models (top panel from population L, bottom from population T) used to generate the input seismograms for the FNO network. Middle panels, the velocity model predictions (outputs from the FNO). Right panel, profiles through the true and predicted models. The seismic source location is highlighted by the asterisks. In the FNO output, the source location is also predicted by the network. Both velocity models here are each recovered from input data associated with only one randomly located shot into 10 randomly located surface receivers, each.

