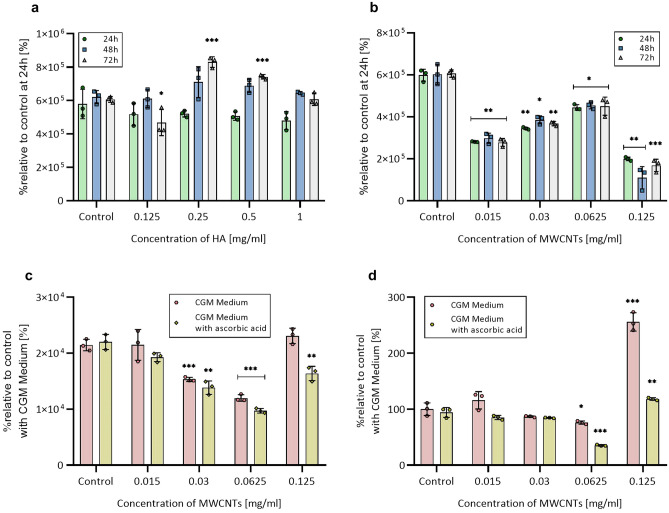
Figure 2.
Relative cell viability, ROS levels, and caspase 3/7 activity in 2D hMSC-AT culture. (a) Relativeiability of hMSC-AT after exposure to different concentrations of HA. (b) Relative viability of hMSC-AT after exposure to different concentrations of MWCNTs. (c) Relative ROS generation after 24 h exposure to MWCNTs. (d) Relative caspase 3/7 activity after 24 h incubation with MWCNTs. The data are presented as the mean ± SD. The statistical significance was determined by two-tailed Student’s t-test (n = 3; additive vs control: *P < 0.05; **P < 0.01 and ***P < 0.001).

