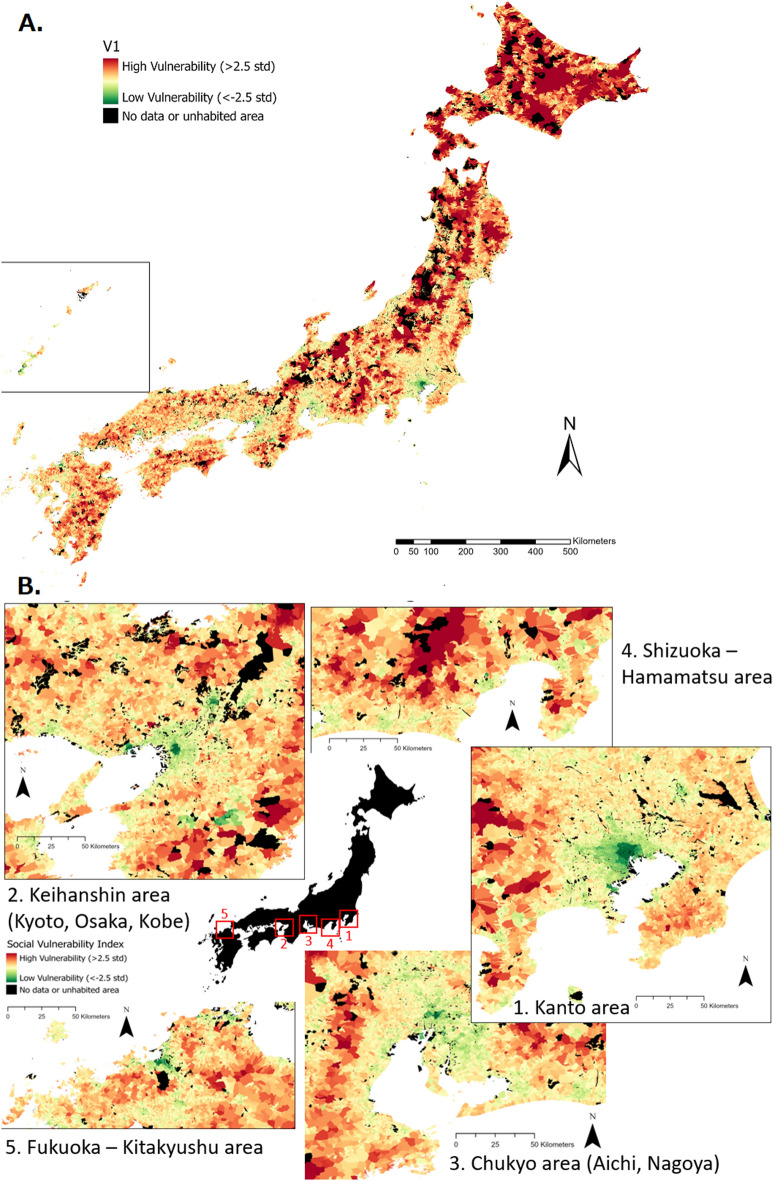
Figure 3.
Measure of social vulnerability in Japan. (A) Whole country (B) Five major urban areas. The classification is made by standard deviation, where high vulnerability zones are red (more than 2.5 standard deviations above the average) and low vulnerability zones are green (more than 2.5 standard deviations below the average). Black zones are either unpopulated or lack data to be included in the analysis. Map generated using ArcGIS Pro 2.9.

