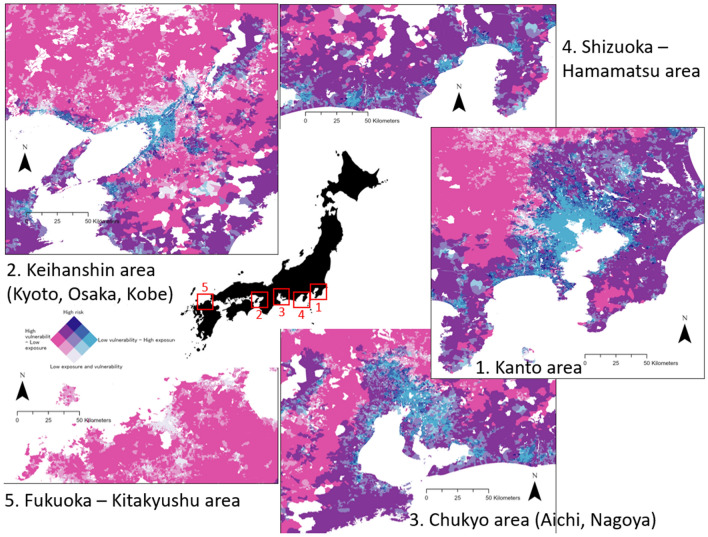
Figure 5.
Earthquake risk in major urban areas in Japan (ranking by order of importance), two-dimensional legend representation of social vulnerability and population exposure to earthquake disaster. The left colour ramp (white/pink) represents 3 levels of social vulnerability while the right color ramp (white/light blue) represents 3 levels of exposure to earthquake disaster. The focus is on the high vulnerability areas with high exposure to earthquake hazard, resulting is high risk area for earthquake disaster. Map generated using ArcGIS Pro 2.9.

