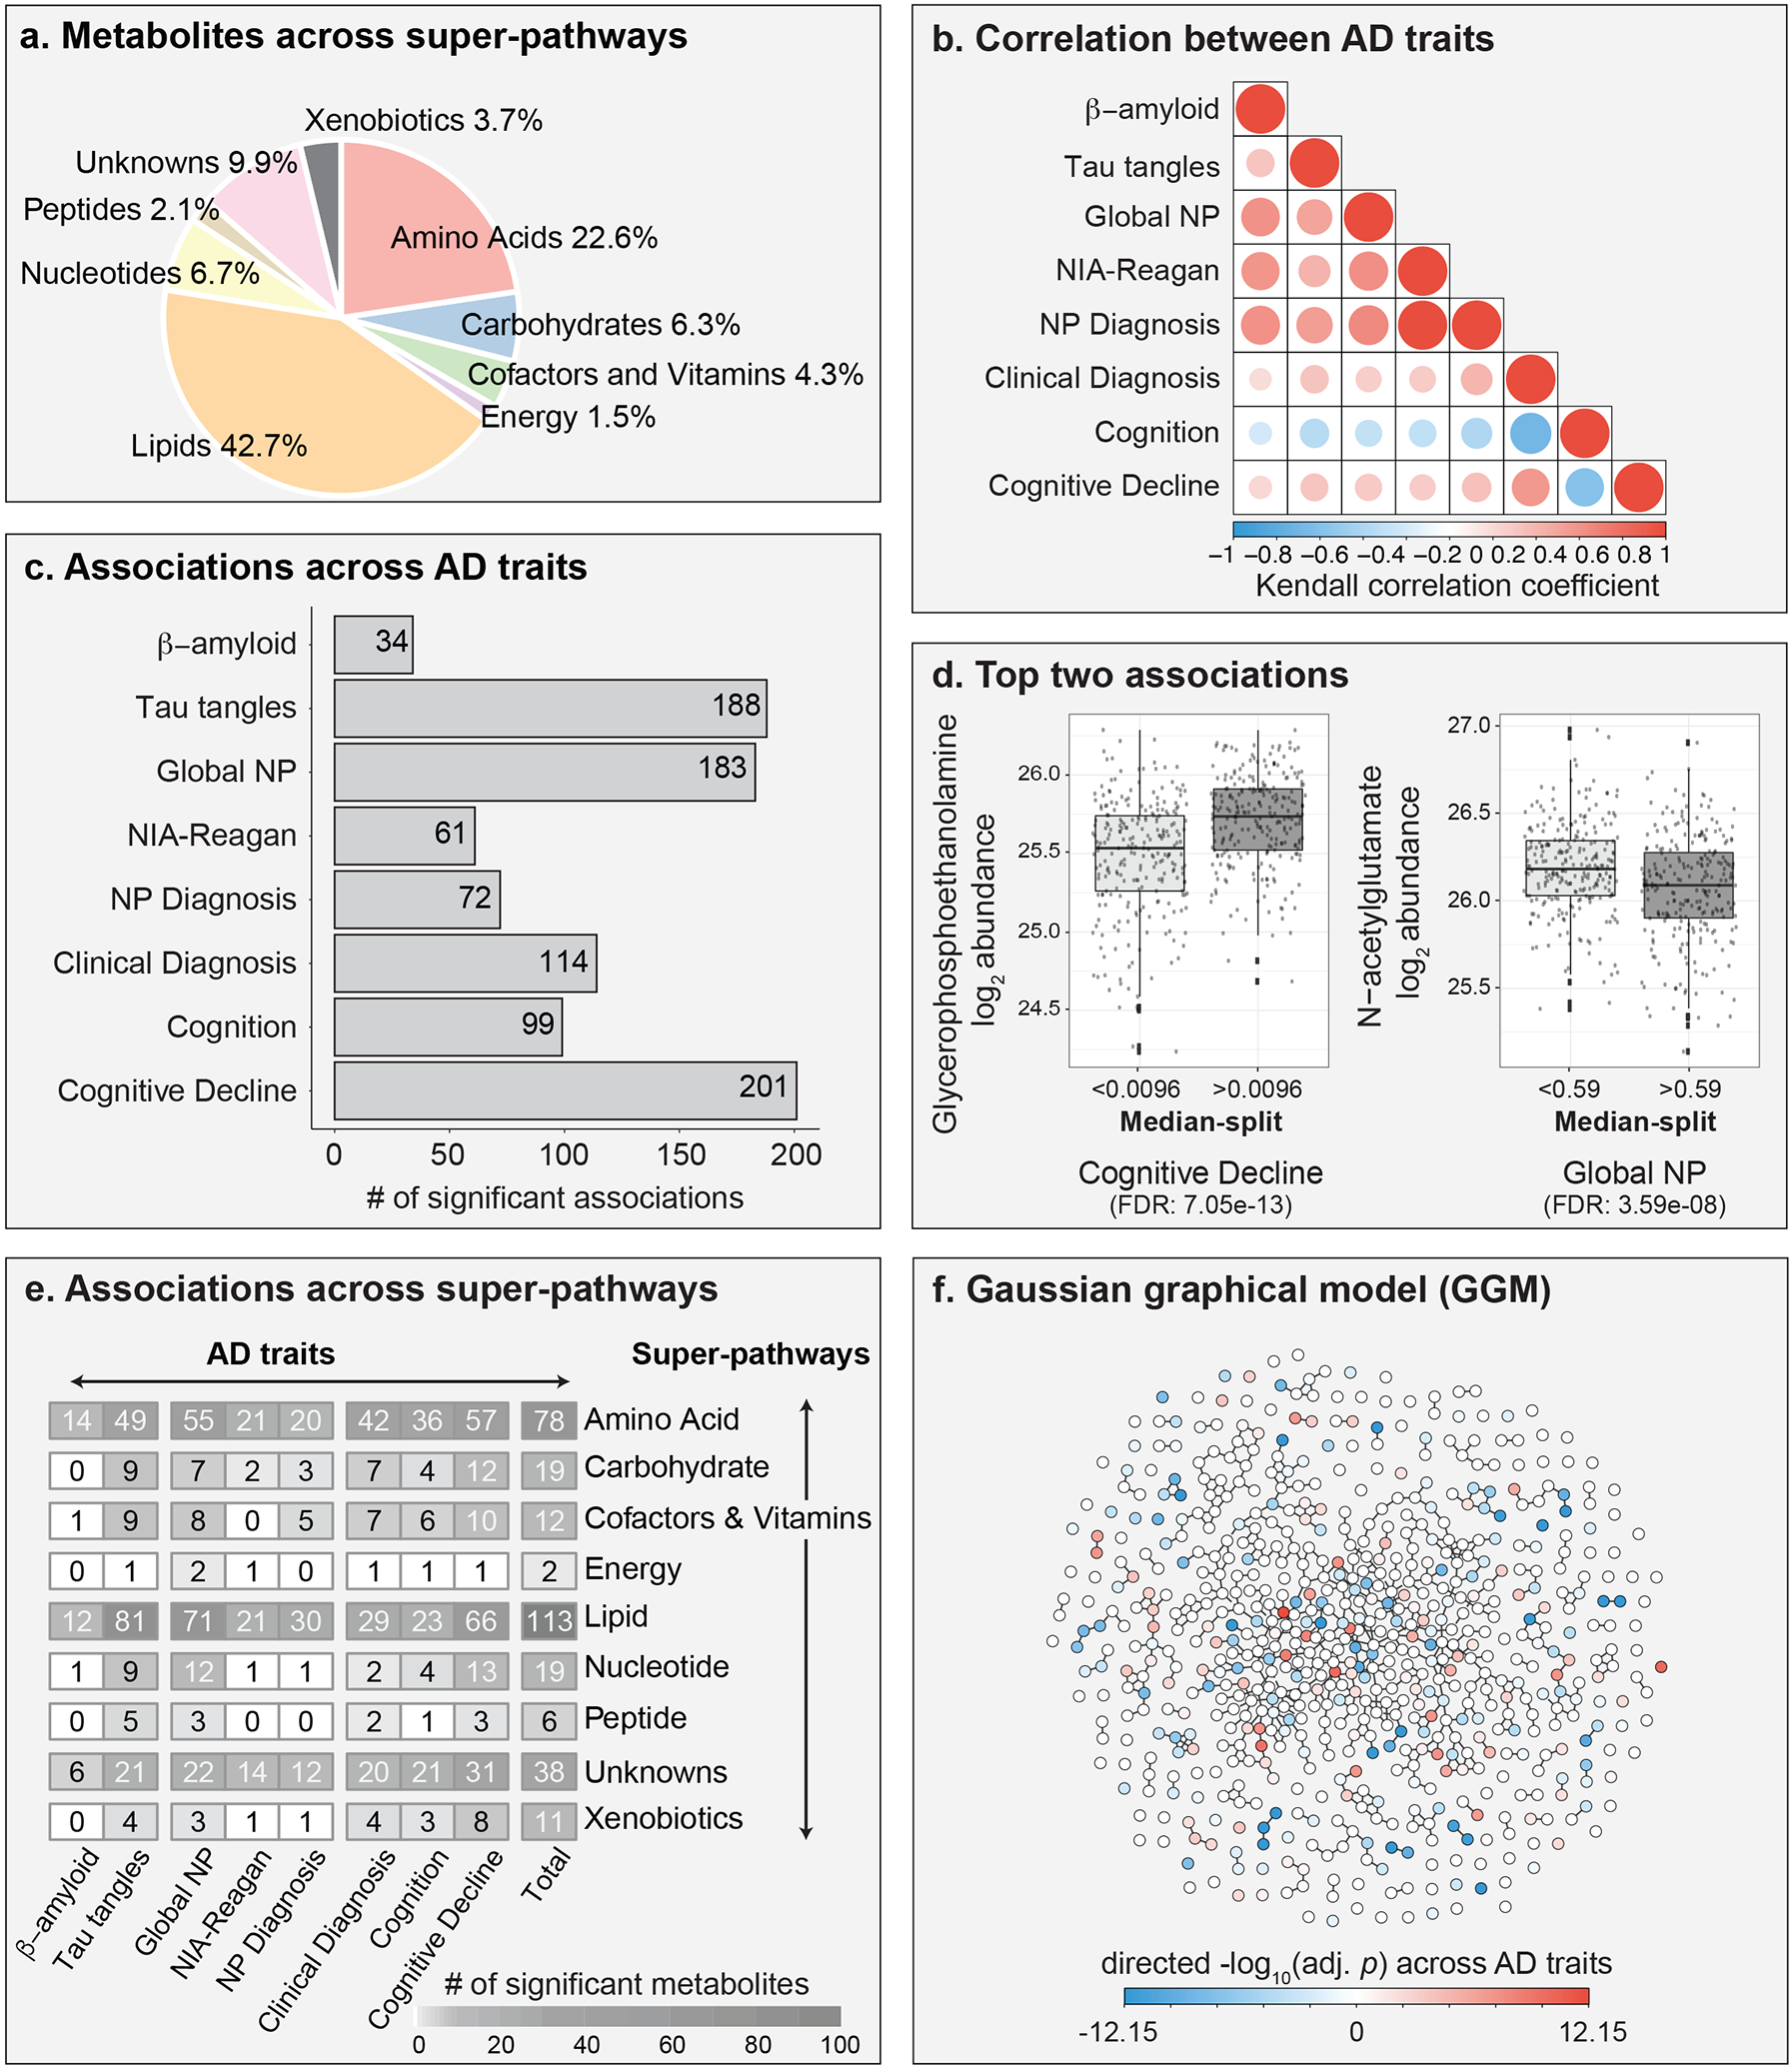
Figure 2: Overview of metabolic associations with AD traits.

a, Metabolites measured in brain samples are distributed across various metabolic classes, referred to as “super-pathways” throughout the manuscript. b, Kendall correlations across the eight AD-related traits. c, A total of 298 metabolites were associated with at least one of the eight AD-related traits. d, Examples of two metabolites with the lowest adjusted p-values. Note that the traits were discretized (median split) for visualization. e, Distribution of metabolic associations across super-pathways. f, Gaussian graphical model of metabolites. Metabolites are colored based on the negative log10 of the lowest adjusted p-value across AD-related traits multiplied with the direction of the respective effect estimate. Global NP = Global burden of AD neuropathology. NP Diagnosis = postmortem diagnosis based on Braak stage and CERAD score. Cognition = cognitive assessment scores from last premortem test. Cognitive Decline = Change in cognitive assessment scores over time until death.
