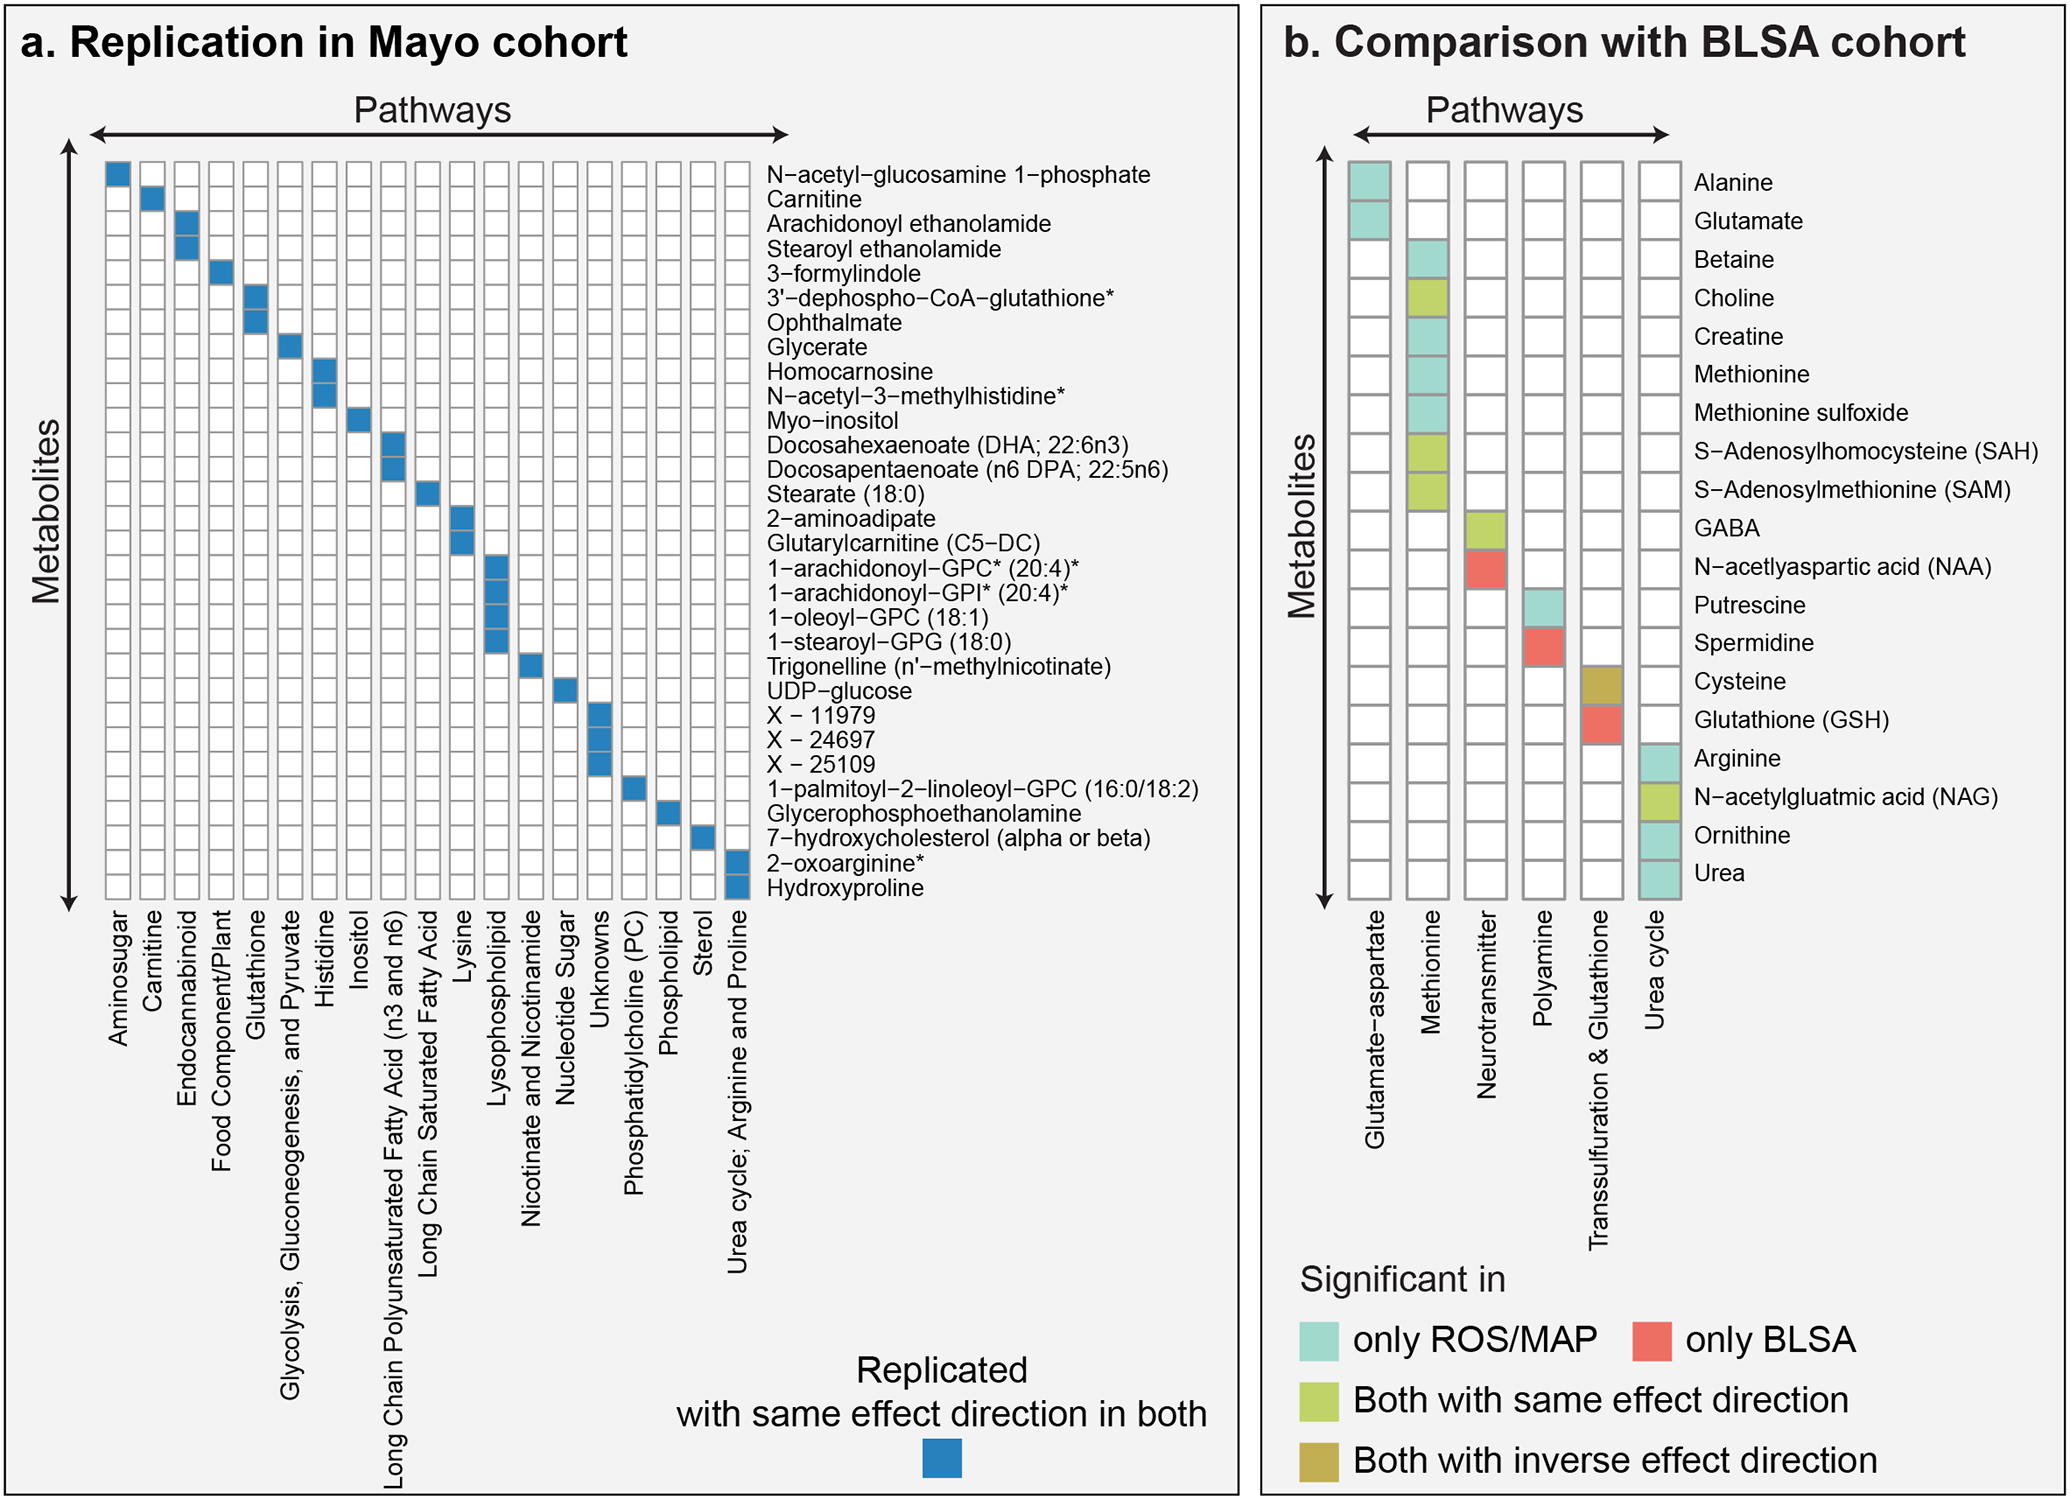
Figure 3: Overlap across independent cohorts and brain regions.

a, The Mayo and ROS/MAP cohorts have 30 metabolic associations with consistent effect directions in common. b, The BLSA and ROS/MAP cohorts have 5 metabolic associations with consistent effect directions in common (green and brown). Cysteine showed inconclusive effect directions, with a positive association with AD in the BLSA cohort and a negative association with AD traits in the ROS/MAP cohort.
