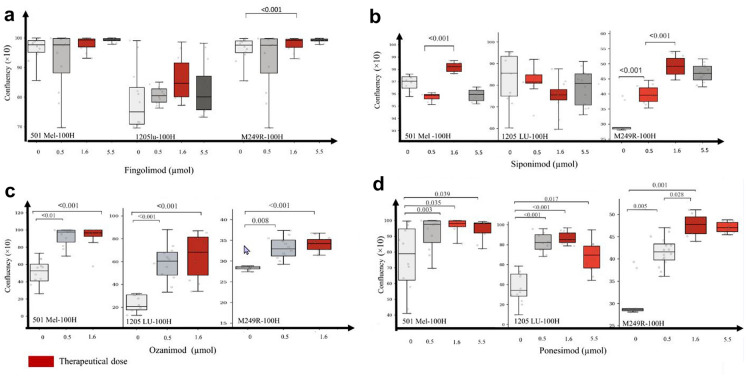
Fig. 2.
Dose effect of S1P1-RM on different melanoma cells lines. a Confluences of 501Mel, 1205LU, and M249R cell lines after 100 h of treatment with fingolimod at 0 µM, 0.5 µM, 1.6 µM, and 5.5 µM. Proliferation was stable from 0 to 5.5 µM in 501Mel cells line (p = 0.17). Median values of 1205LU cell line confluences steadily increased 45.62 (IQR 27.57), 57.84 (IQR 10.04), 67.11 (IQR 25.43), and 56.95 (IQR 25.32) (p = 0.13). Differences of proliferation were found at 0.5 µM vs 0 µM (p = 0.006), 1.6 µM vs 0 µM (p < 0.001), 5.5 µM vs 0 µM (p < 0.001), and 5.5 µM vs 0.5 µM (p = 0.014) in M249R. b Proliferation of 501Mel under siponimod was not linear from 0.5 to 5.5 µM but confluences increased significantly at 1.6 µM vs 0.5 µM (p < 0.001) whereas proliferation was stable from 0 to 5.5 µM, and no significant differences were found in 1205 cell lines. Proliferation of M249R cell lines increased for 1.6 µM vs 0 µM (p < 0.001), 1.6 µM vs 0.5 (p < 0.001), and 0.5 µM vs 0 µM (p < 0.001) under siponimod treatment. c Proliferation of 501Mel was not linear under ozanimod from 0.5 to 5.5 µM but confluences increased significantly at 1.6 µM vs 0.5 µM (p < 0.001). Proliferation was stable from 0 to 5.5 µM in 1205LU whereas proliferation of M249R cell lines increased for 1.6 µM vs 0 µM (p < 0.001), 1.6 µM vs 0.5 (p < 0.001), and 0.5 µM vs 0 µM (p < 0.001). d Under ponesimod treatment, proliferation of 501Mel increased at 0.5 µM vs 0 µM (p = 0.035), 1.6 µM vs 0 µM (p = 0.003), and 5.5 vs 0 µM (p = 0.039). Proliferation of 1205LU increased at 0.5 µM vs 0 µM (p < 0.001), 1.6 µM vs 0 µM (p < 0.001), 5.5 µM vs 0 µM (p = 0.017), and 5.5 µM vs 0.5 µM (p = 0.046). Proliferation of M249R increased at 0.5 µM vs 0 µM (p = 0.005), 1.6 µM vs 0 µM (p < 0.001), 1.6 µM vs 0.5 µM (p = 0.028)

