. 2023 Jan 15;24(1):32–49. doi: 10.1631/jzus.B2200269

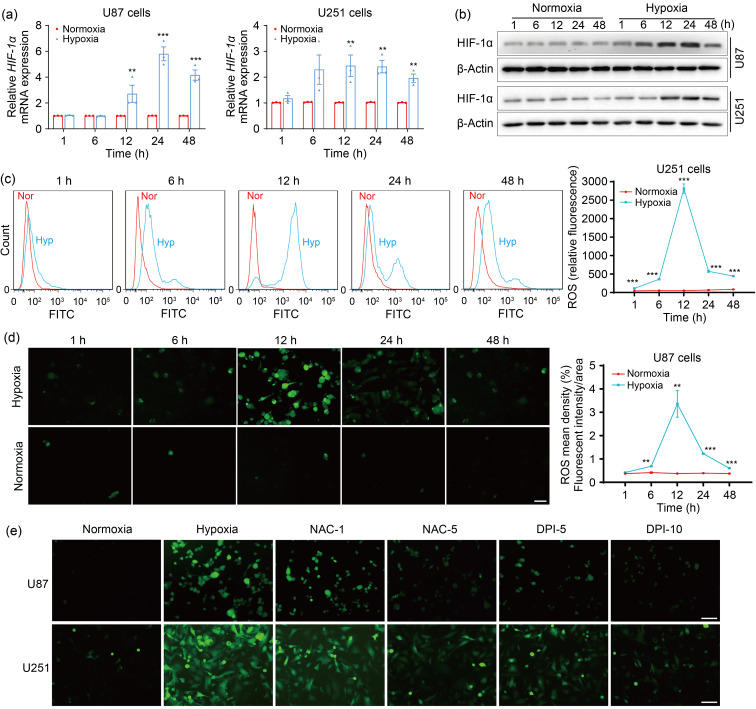
Fig. 1. Hypoxia increases intracellular ROS levels in GBM cells. (a, b) qPCR (a) and western blotting (b) were performed to detect the mRNA and protein expression, respectively, of HIF-1α at 1, 6, 12, 24, and 48 h after normoxic or hypoxic treatments. (c) Flow cytometry was used to assess ROS levels at the indicated time intervals after normoxic or hypoxic exposure. (d) ROS levels were determined using fluorescence under normoxia or hypoxia after the indicated time intervals (scale bar=100 μm). (e) ROS production was analyzed by fluorescence microscope when cells were pretreated with or without ROS inhibitors (NAC (1 or 5 mmol/L) or DPI (5 or 10 μmol/L)) for 4 h and then exposed to hypoxia for 12 h (scale bar=100 μm). The normoxia group was used as negative control. Data are expressed as mean±SEM (n=3). ** P<0.01, *** P<0.001, vs. normoxia group. ROS: reactive oxygen species; GBM: glioblastoma; qPCR: quantitative real-time polymerase chain reaction; mRNA: messenger RNA; HIF-1α: hypoxia-inducible factor-1α; NAC: N-acetyl-L-cysteine; DPI: diphenyleneiodonium chloride; SEM: standard error of the mean; Nor: normoxia; Hyp: hypoxia; FITC: fluorescein isothiocyanate.

Fig. 1