. 2023 Jan 15;24(1):32–49. doi: 10.1631/jzus.B2200269

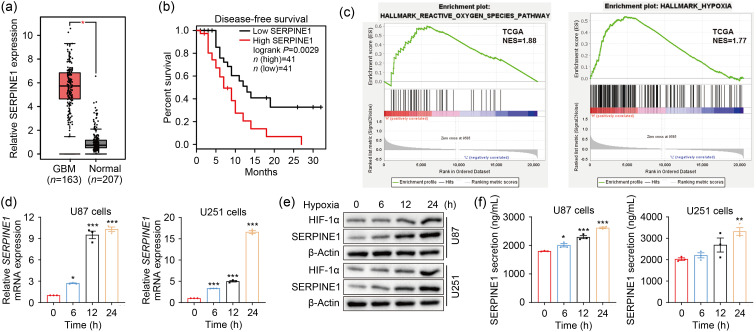
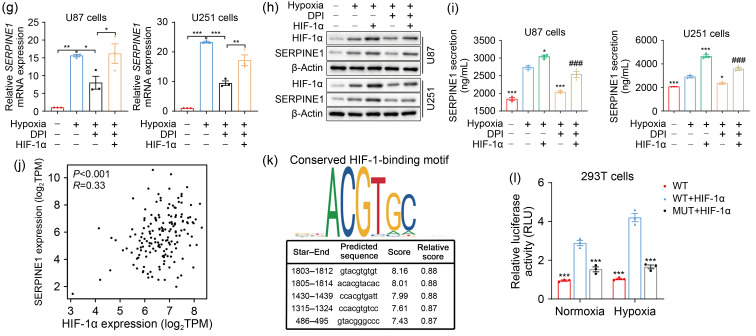
Fig. 5. SERPINE1 is the downstream gene of the ROS-HIF-1α axis. (a) SERPINE1 expression in GBM and normal tissues was analyzed on the TCGA datasets using GEPIA2. (b) The GEPIA2 website was used for the survival analysis (cutoff:median) of GBM patients in terms of high SERPINE1 expression vs. low SERPINE1 expression. (c) GSEA analysis was conducted to determine ROS pathway and hypoxia enrichment in SERPINE1-high GBM tissues. (d, e) The mRNA (d) and protein (e) expression levels of SERPINE1 were detected at 6, 12, and 24 h under normoxic or hypoxic environment. (f) The levels of extracellular SERPINE1 were examined by ELISA kits at the indicated normoxia or hypoxia intervals. * P<0.05, ** P<0.01, *** P<0.001, vs. 0 h group. (gi) qPCR (g), western blotting (h), and ELISA (i) analyses were performed to assess the effects of ROS and HIF-1α on SERPINE1 expression and secretion. Cells were transfected with or without HIF-1α expression plasmid for 20 h, and then treated using 10 μmol/L DPI followed by hypoxic stimulus for 24 h. * P<0.05, ** P<0.01, *** P<0.001, vs. hypoxia group; ### P<0.001, vs. hypoxia+HIF-1α group. (j) SERPINE1 expression was plotted as a function of HIF-1α expression using GEPIA2 (correlation coefficient: Spearman). (k) JASPAR analysis was performed to find the possible sites where HIF-1α binds to SERPINE1 promoters. (l) Luciferase assay was conducted to analyze the effect of HIF-1α on SERPINE1 activity under normoxia and hypoxia. For normoxic treatments, cells were transfected with SERPINE1 reporter plasmids (WT or MUT) and/or HIF-1α expression plasmid for 48 h. For hypoxic treatments, cells were transfected with the above plasmids under normoxia for 24 h and then under hypoxia for another 24 h. *** P<0.001, vs. WT+HIF-1α group. Data are expressed as mean±SEM (n=3). SERPINE1: serine protease inhibitor family E member 1; ROS: reactive oxygen species; HIF-1α: hypoxia-inducible factor-1α; GBM: glioblastoma; TCGA: The Cancer Genome Atlas; GEPIA2: Gene Expression Profiling Interactive Analysis 2; GSEA: Gene Set Enrichment Analysis; mRNA: messenger RNA; ELISA: enzyme-linked immunosorbent assay; qPCR: quantitative real-time polymerase chain reaction; DPI: diphenyleneiodonium chloride; WT: wild-type; MUT: mutant type; SEM: standard error of the mean; NES: normalized enrichment score; TPM: transcripts per million; RLU: relative luciferase unit.

graphic file with name JZhejiangUnivSciB-24-1-32-g005a.jpg

graphic file with name JZhejiangUnivSciB-24-1-32-g005b.jpg