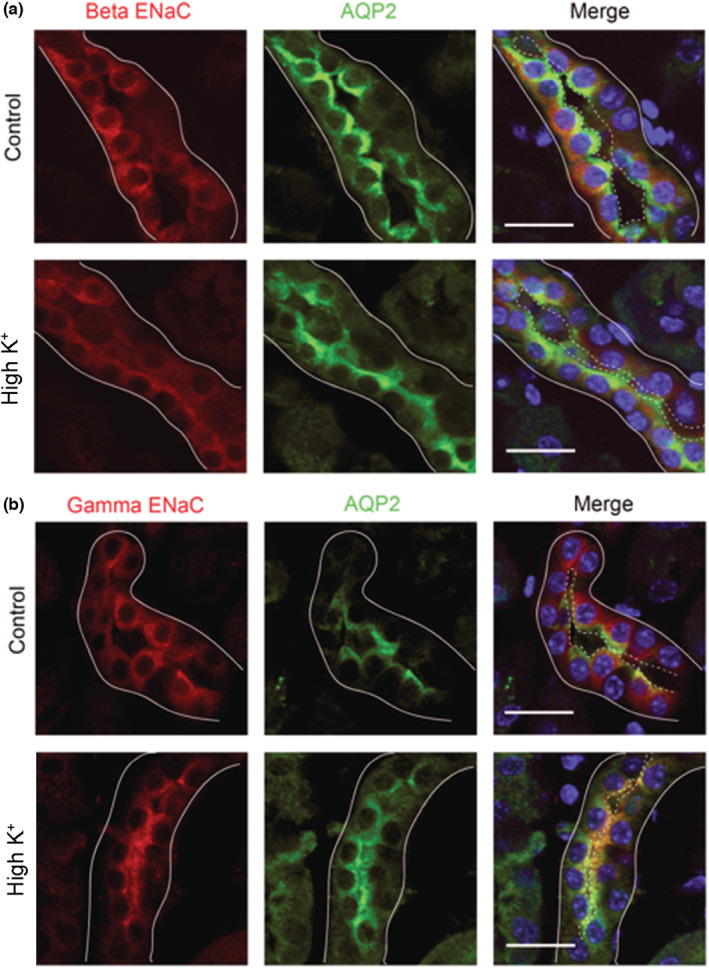
FIGURE 6.

Immunofluorescent staining reveals movement of the β‐ and γ‐subunits from an intracellular location to apical surface with a high K+ diet. Kidneys from mice kept on a control diet (top) or 4 days of a high K+ diet (bottom) were probed for expression of (a) the β‐subunit of ENaC or (b) the γ‐subunit of ENaC. Sections were counterstained for AQP2 (green) to indicate principal cells. The basolateral surfaces of tubules are denoted by solid lines and the apical surface by dashed lines. Scale bars represent 20 μm and images are representative of three separate regions examined in three mice of each treatment.
