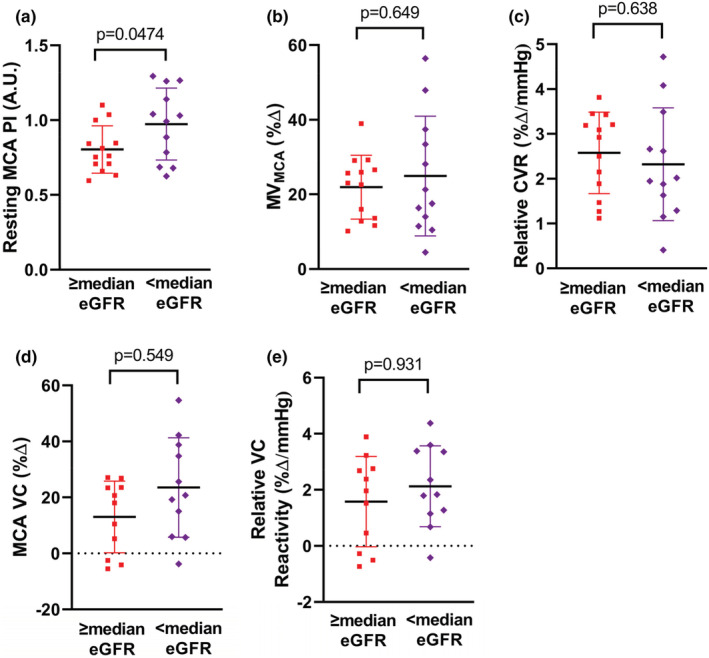
FIGURE 4.

Resting pulsatility index (PI) of the middle cerebral artery (MCA), calculated as (MCA velocity systole—MCA velocity diastole)/(MCA velocity mean) (panel a). Percent change in mean velocity of the MCA (MVMCA) in response to hypercapnia in participants with a CKD‐EPI eGFR ≥median (red squares) and < median (purple diamonds) (panel b). Relative cerebrovascular reactivity (CVR), calculated as percent change in MVMCA normalized to absolute change in end‐tidal CO2 in response to hypercapnia (panel c). Percent change in vascular conductance (VC; MVMCA/mean arterial pressure) (panel d). Percent change in relative VC, calculated as percent change in VC normalized to absolute change in end‐tidal CO2 in response to hypercapnia (panel e). Horizontal lines represent mean, vertical lines represent s.d., and squares/diamonds represent individual participants. Comparisons between groups were evaluated by an independent sample t‐test. N = 2 with eGFR ≥ median and n = 1 with eGFR <median missing in panel (c) and (d) due to missing mean arterial pressure.
