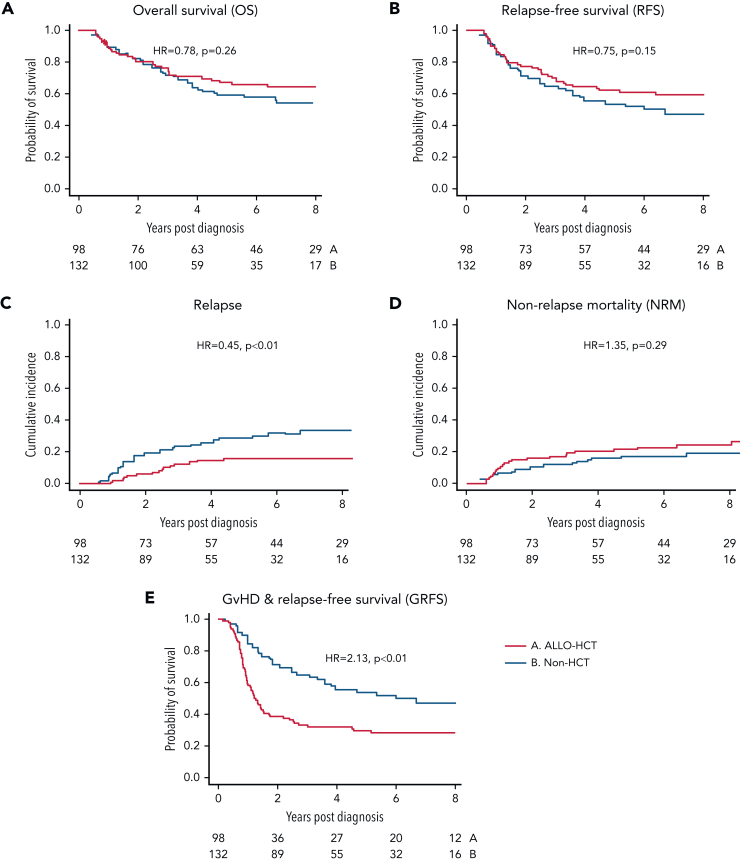
Figure 2.
Outcomes by unadjusted analysis. (A) OS, (B) RFS, (C) CIR, (D) NRM, and (E) GRFS. Hazard ratios are reported without adjustment for covariates. P values are reported per the log-rank test. Red line represents cohort receiving consolidation allogeneic hematopoietic cell transplant (allo-HCT). Blue line represents non-HCT cohort.

