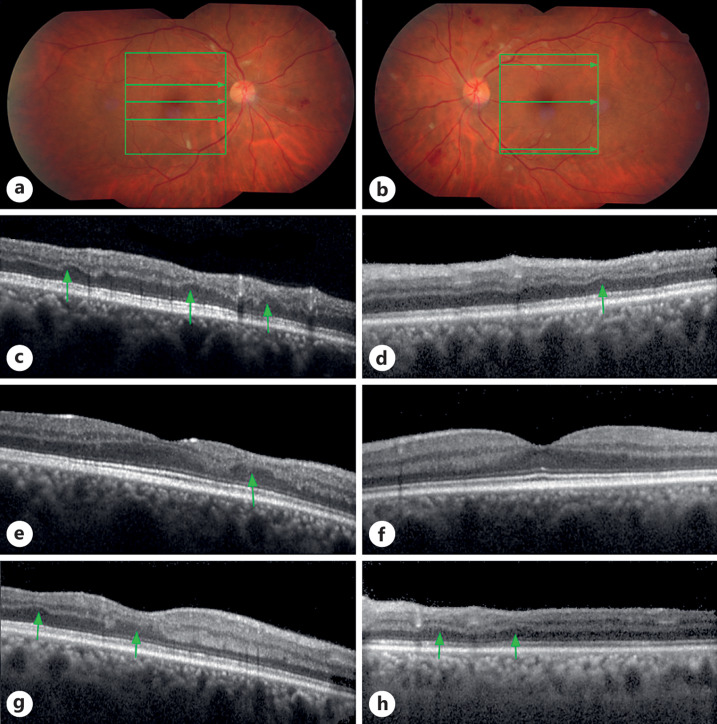
Fig. 1.
Color fundus and OCT imaging: HIV retinopathy and INL thinning. a Right eye at presentation: cotton wool spots, pre-, and intraretinal hemorrhages. OCT scan frame and scan lines are presented as green square and arrows. b Left eye at presentation: cotton wool spots, pre-, and intraretinal hemorrhages, extending in a larger region than in the right eye but respecting the macula. c, e, g OCT scans of the right eye, revealing areas with INL thinning (arrows), including the macula. Scan lines are presented in A above as green arrows. d, f, h OCT scans of the left eye, revealing areas with INL thinning (arrows), respecting the macula. Scan lines are presented in B above as green arrows.

