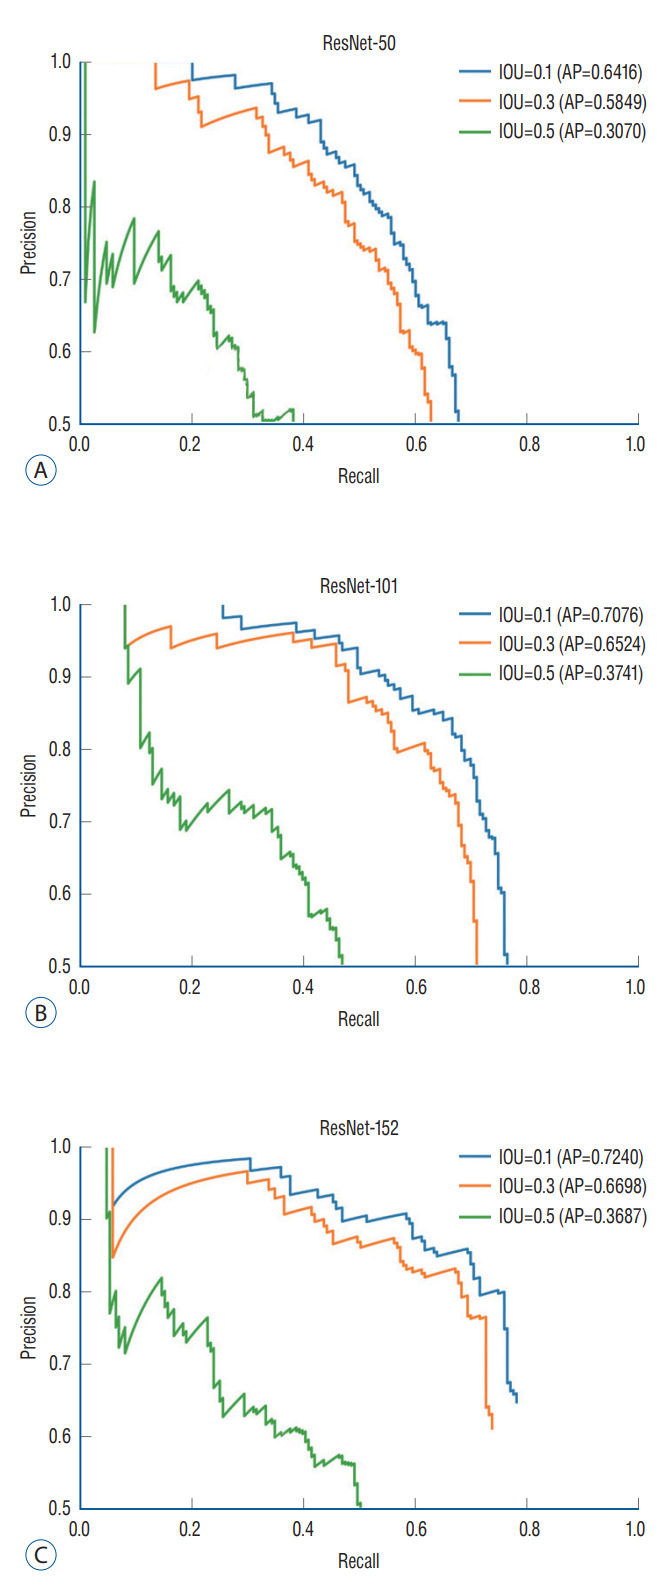
Fig. 3.

Precision-recall curve. The diagnostic performance of object detection using RetinaNet was assessed by the precision-recall curve and the average precision (AP). AP is calculated as the area under the precision-recall curve. AP values for ResNet models and intersection over union (IOU) thresholds were analyzed.
