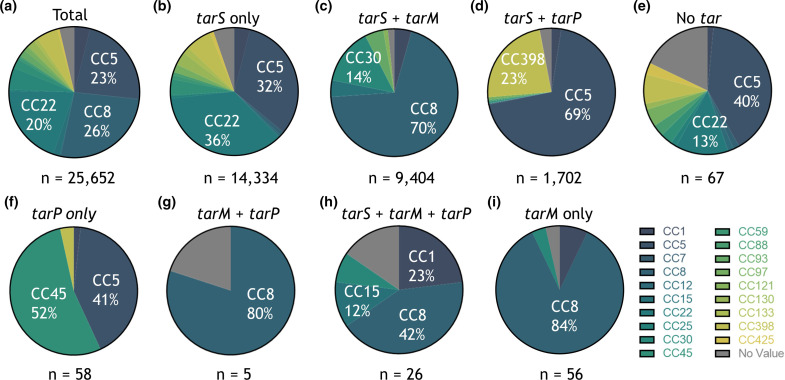
Fig. 1.
The tar genotype is linked to S. aureus clonal complexes. (a) Distribution of CCs for isolates within the PubMLST database on the extraction date. Only CCs that comprise >10 % of isolates are indicated. Colour coding of CCs is shown in the key on the right. (b–i) S. aureus CC distribution is shown for each tar genotype indicated as in (a). The difference between the CC distribution of each tar genotype compared to the total CC distribution was statistically significant for all tar genotypes (P<0.0001), except for (g) tarM+tarP (P=0.89).

