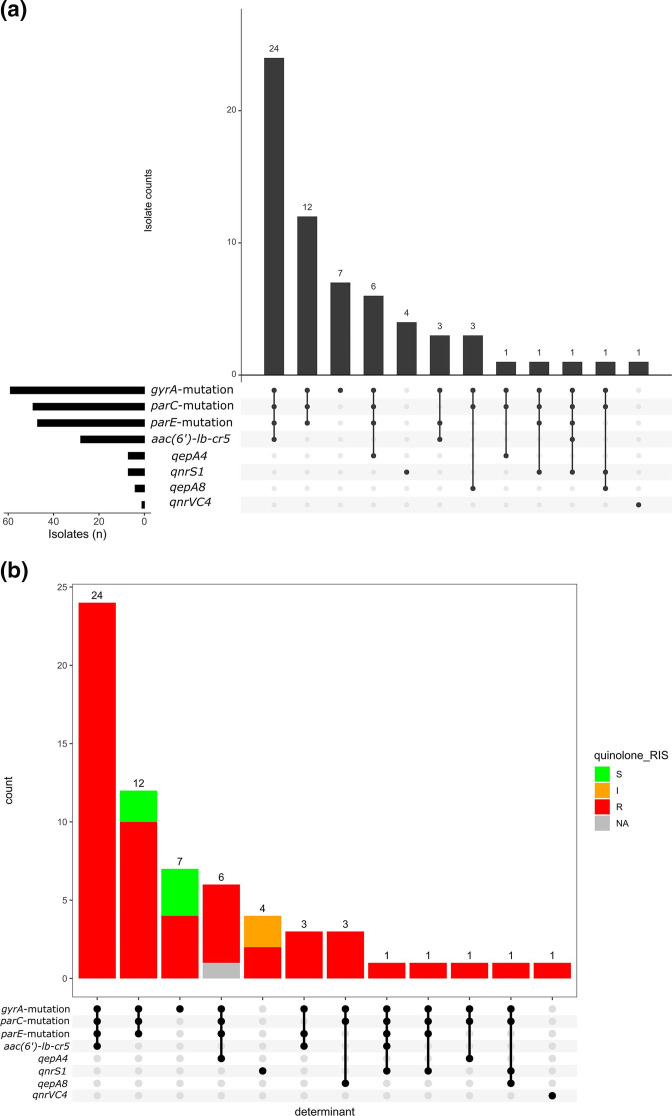
Fig. 7.
Quinolone-resistance gene combinations in ExPEC isolates. The upset plots (a, b) show the number of ExPEC isolates carrying each combination of genes conferring resistance to the quinolones, and (b) is coloured by the proportion of observed phenotypic antimicrobial susceptibility, and is ordered in descending order by the frequency of resistance gene profiles observed. The side bar chart in (a) demonstrates the number of isolates that carry each of the resistance genes. The dots and lines between dots at the base of the main bar chart (and the right side of the side bar chart) show the co-resistance gene profile of the ExPEC isolates. NA, phenotypic antimicrobial-susceptibility data for the isolate is absent.

