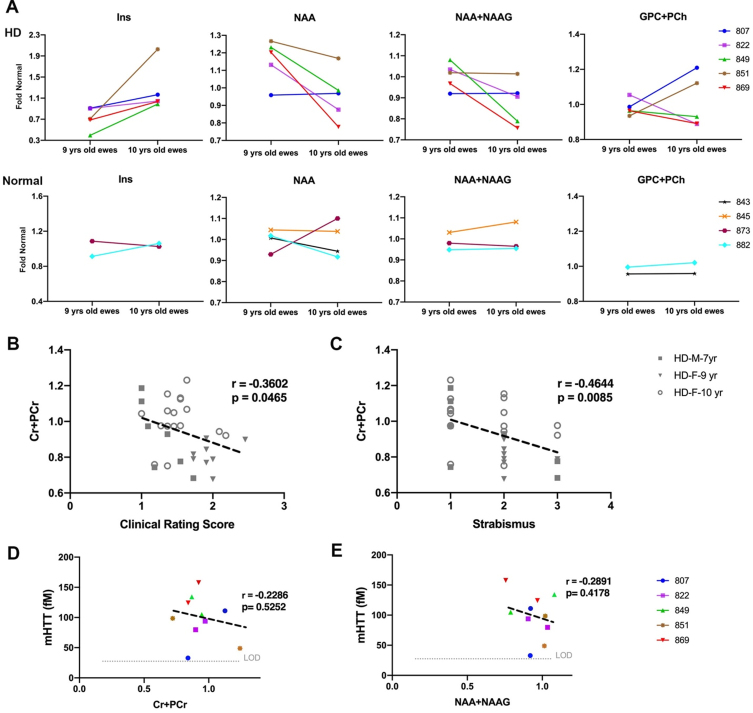
Fig. 5.
Change in metabolite concentration of HD sheep. A) Top row shows metabolite concentration of individual HD females (n = 5) sampled at 9 and 10 years of age illustrating increases in gliosis marker (Ins), decrease in neuronal health marker (NAA, NAA+NAAG) over 1 year. Two HD sheep showed increase in marker of demyelination (GPC+PCh). Bottom row shows metabolite concentrations of control females (n = 4) sampled at 9 and 10 years of age. Metabolite concentrations are normalized to the mean metabolite concentration in normal sheep. Marker of energy metabolism (Cr+PCr) for all the HD males (n = 7) and HD females (n = 25) showed significant correlation with (B) clinical rating score and (C) strabismus. mHTT levels in CSF of HD females (n = 5) sampled at 9 and 10 years of age showed negative association with (D) marker of energy metabolism (Cr+PCr) and (E) marker of neuronal health (NAA+NAAG). M and F in the legends represent male and female sheep respectively.

