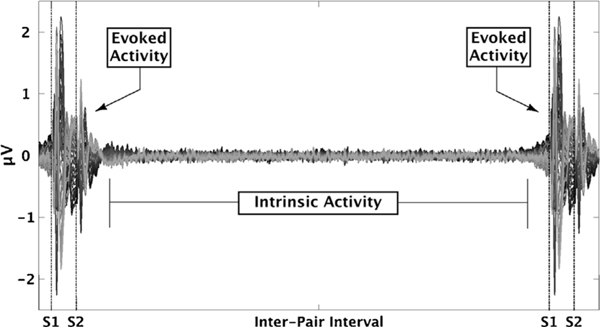
Fig. 1.
Intrinsic Activity. Butterfly plot of mean voltage response averaged over all trials and all healthy participants (N =218). Evoked activity is in response to a paired click stimuli (500 ms interval between clicks). Intrinsic activity was quantified using the intervals between each evoked response.

