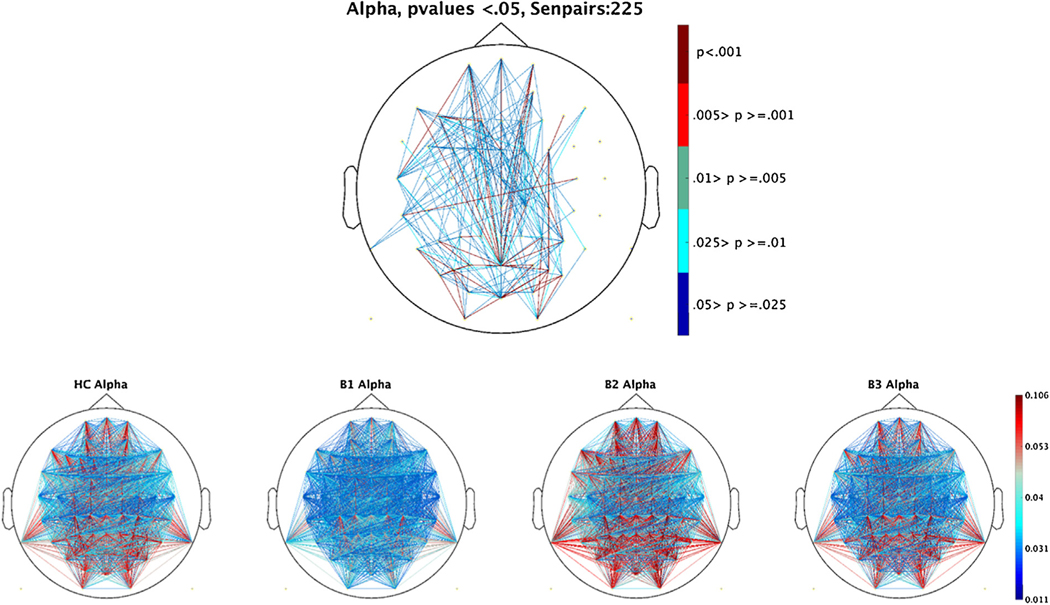
Fig. 4.
Debiased Weighted Phase lab index for each sensor pair (2016) after Power frequency PCA weights had been applied to the data. A) FDR corrected significant (p < .05) sensor pair group ANOVA results by biotype sub-grouping. B) Group averages by biotype for the alpha frequency band (8–15 Hz). Values range from 0–1. 0 indicates the absence of phase-lagged coupling and 1 indicates the strongest possible coupling. Due to its non-normal distribution, scaling is based off of distribution percentiles from the grand average responses across groups. Tick marks indicate 25th percentiles.

