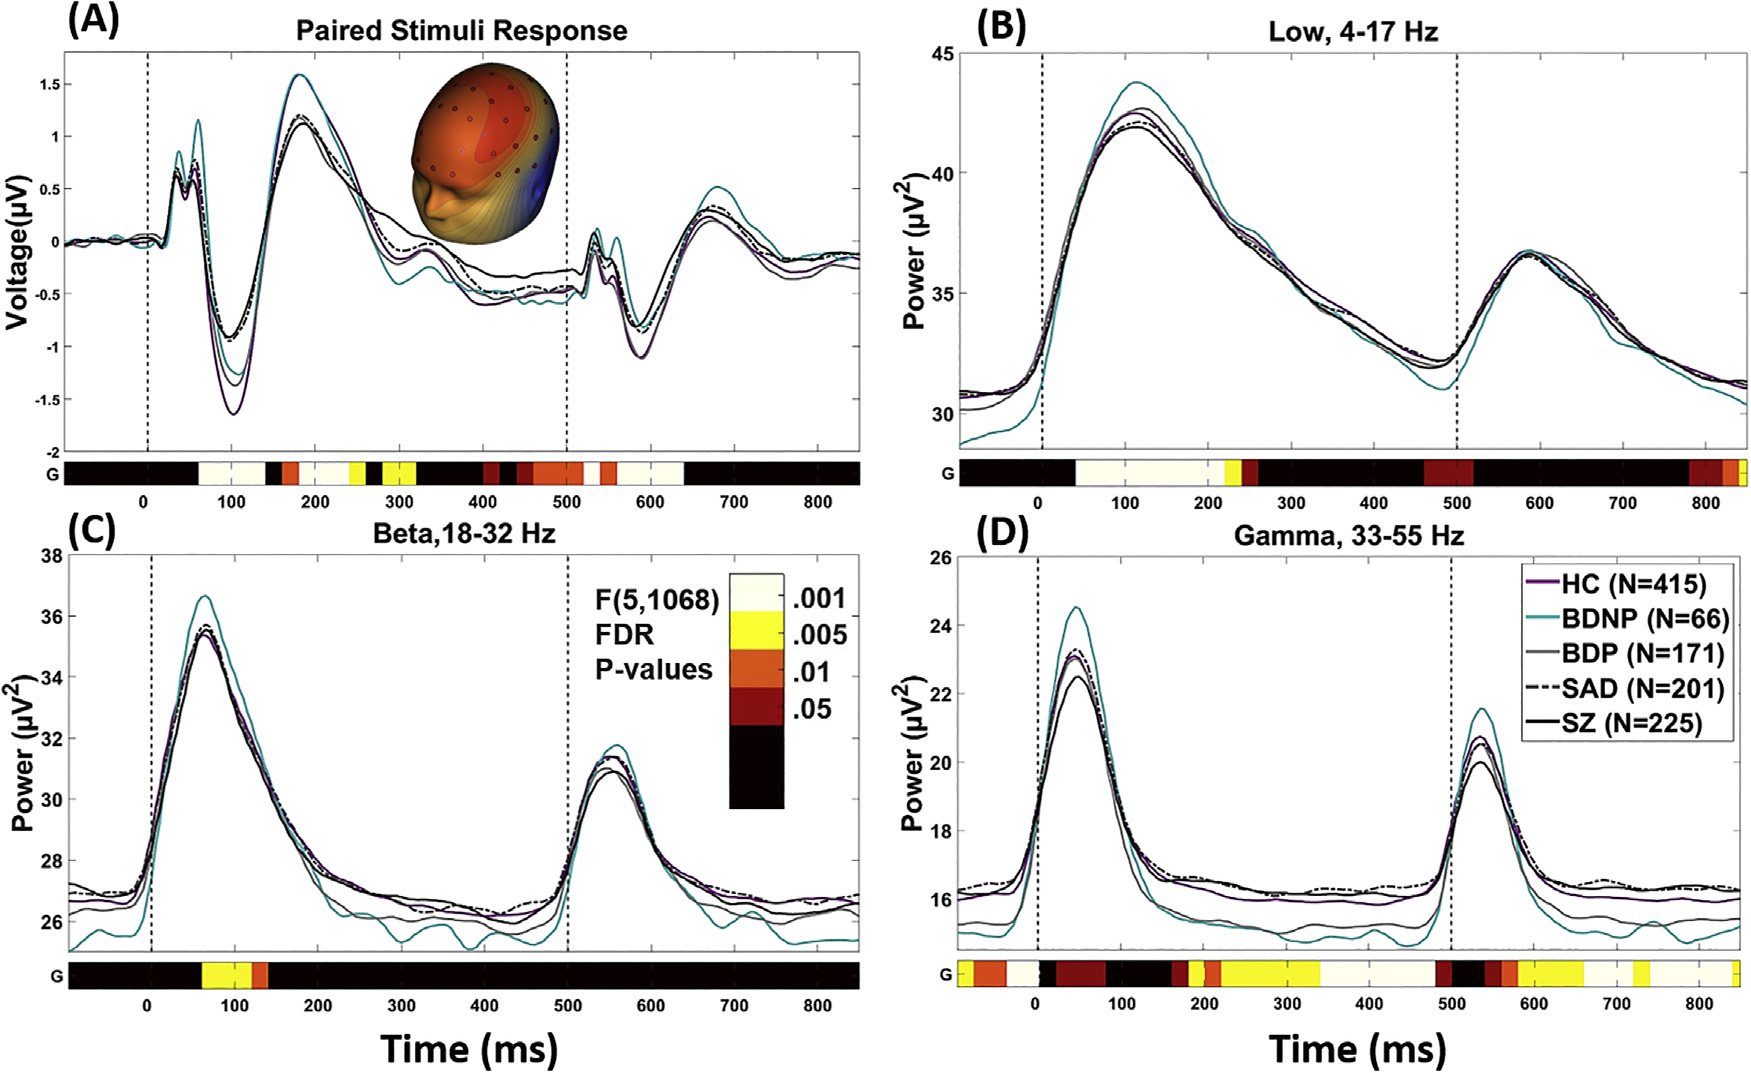
Fig. 2.

Paired stimulus grand average waveforms by group. Note that waveforms are not corrected for age, as this was done at a later stage of processing. The bottom bar indicates where there was a significant main effect of group [F(5,1068), p < .05 (after FDR correction)]. Color Bar indicates the level of significance for each 20 ms time bin. (A) is the spatial PCA component for the grand average ERP. (B), (C), and (D) are grand averages of the time-frequency transformed data from each frequency component averaged over all sensors. D is the spatial PCA component for the grand average ERP. Significant time-ranges were averaged across consecutive time-bins and were demarcated at points of polarity switches for use in post-hoc multivariate analyses. HC, Healthy Subjects; BDNP, Probands with bipolar disorder I without any history of psychotic symptoms; BDP, Probands with bipolar disorder I with a history of psychotic symptoms; SAD, Probands with schizoaffective disorder; SZ, Probands with schizophrenia.
