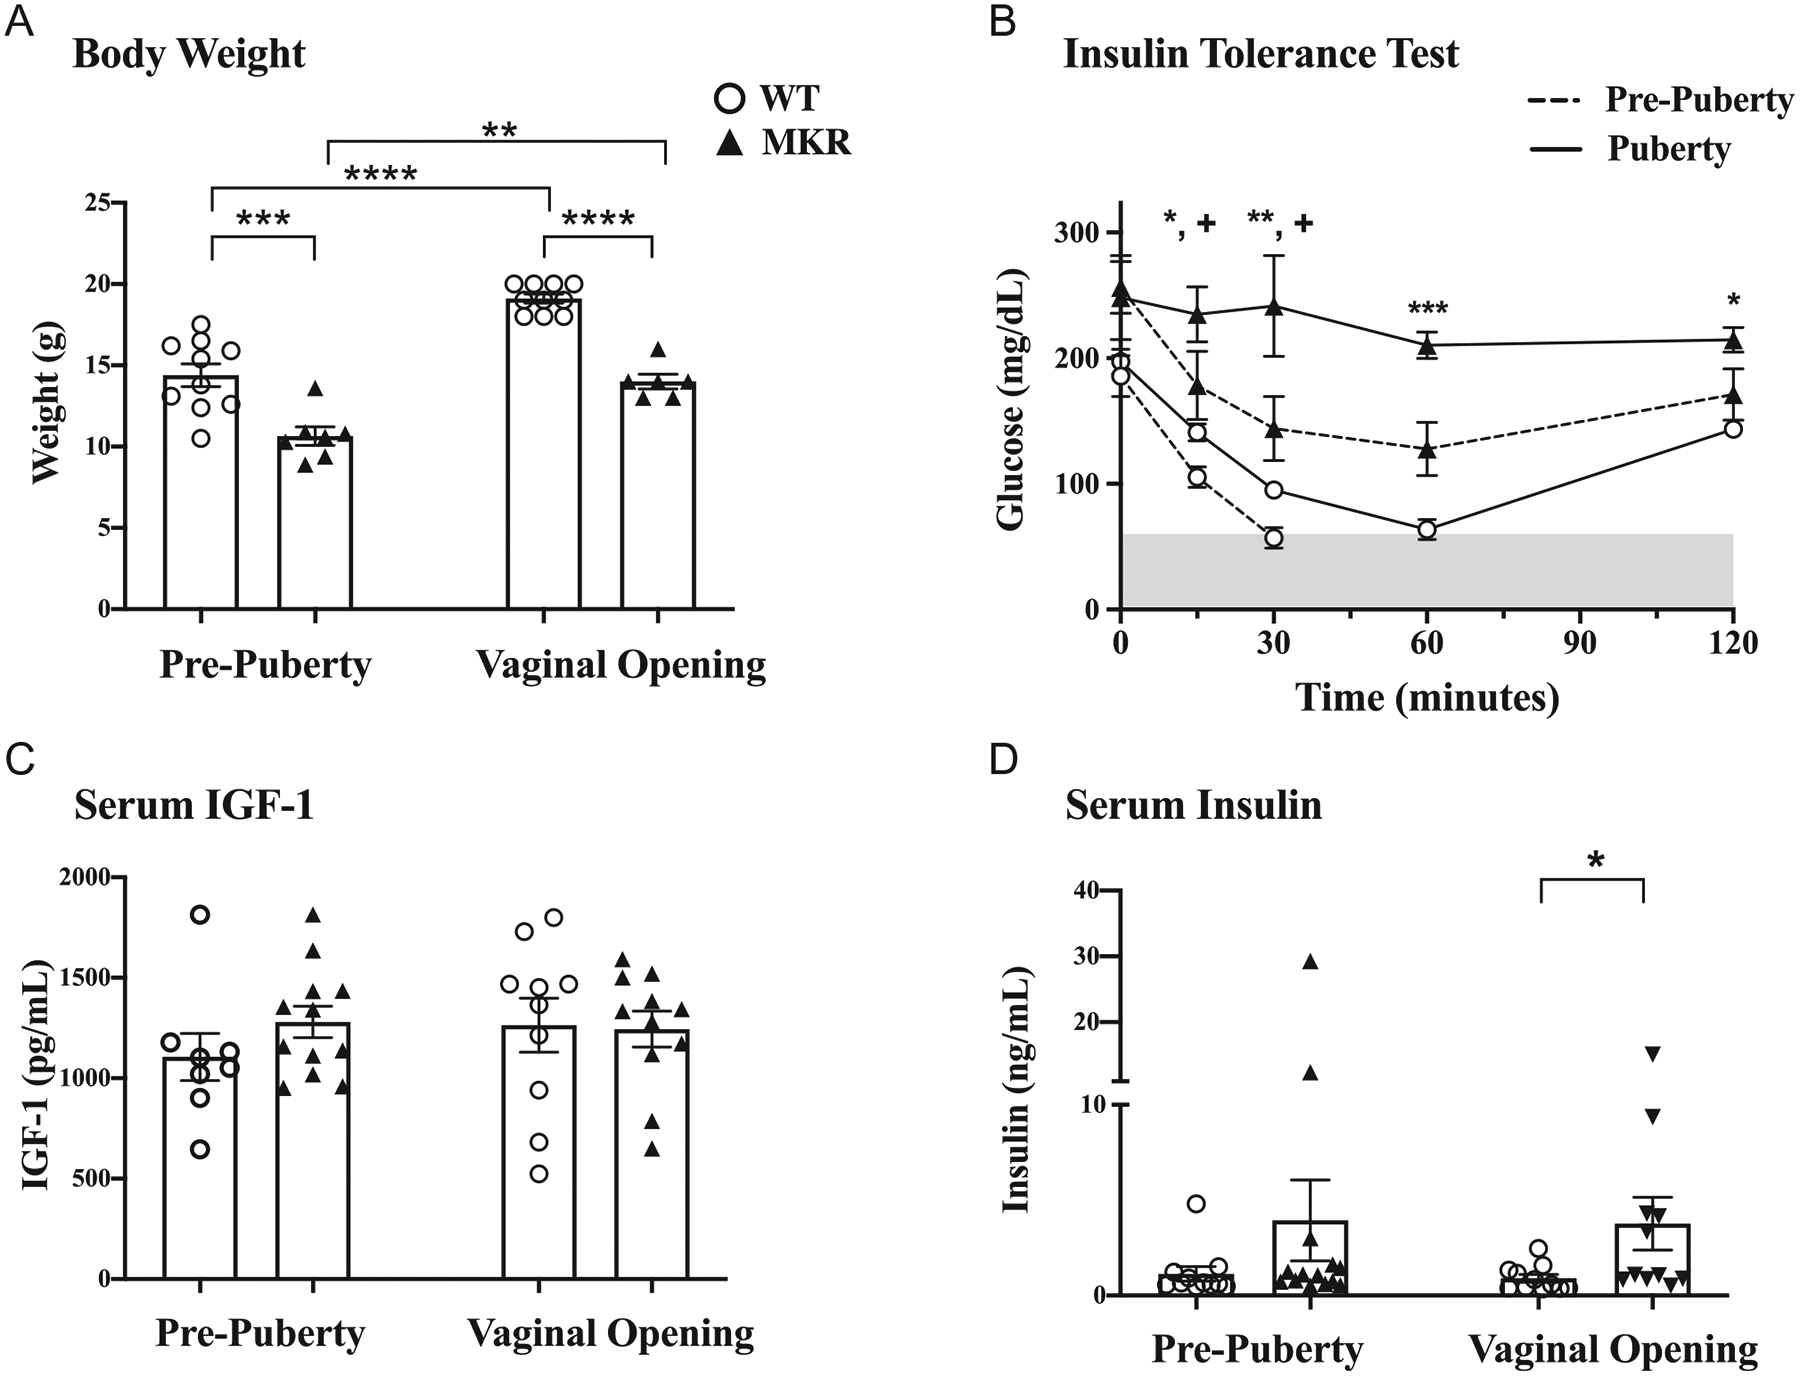
Figure 1.

Metabolic phenotyping of MKR and WT mice before and at onset of puberty. (A) Mean body weight ± s.e.m. (g), n = 6–10 mice in each group at each time point. (B) Insulin tolerance test: blood glucose levels following administration of insulin (1 μ/kg body weight), n = 3 mice in each group at each end point. Shaded area represents hypoglycemia, at glucose levels <60 mg/dL. MKR vs WT at pre-puberty: +P < 0.05; WT vs MKR at VO: *P < 0.05, **P < 0.005, ***P < 0.005. (C) IGF-1 levels (pg/mL), n = 8–12 each group at each end point. (D) Insulin levels (ng/mL), n = 11–14 in each group at each end point. ▲MKR, O WT. *P < 0.05; **P < 0.005; ***P < 0.0005; ****P < 0.0001.
