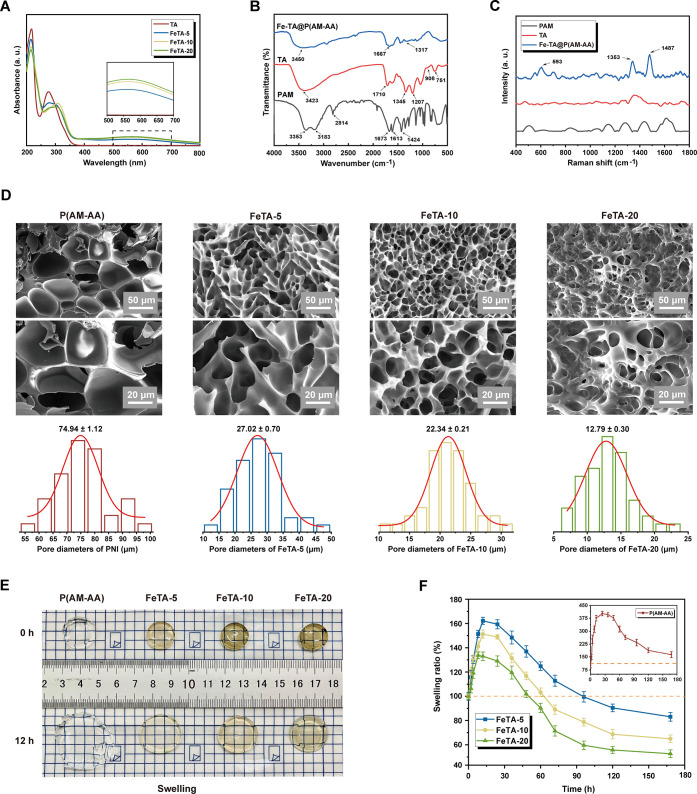
Figure 2.
Structural characterization of the Fe-TA@P(AM-AA) hydrogel. (A) UV–vis absorption spectra of the TA/Fe complex solution with different Fe3+ concentrations (0, 5, 10, and 20 mg/mL). (B) FT-IR spectra of PAM, TA, and Fe-TA@P(AM-AA) hydrogels. (C) Raman spectra of PAM, TA, and Fe-TA@P(AM-AA) hydrogels. (D) SEM images and diameter analysis of Fe-TA@P(AM-AA) hydrogels. (E, F) Swelling properties of the Fe-TA@P(AM-AA) hydrogels with different Fe3+ concentrations in phosphate-buffered saline, pH = 7.4.

