Figure 11.

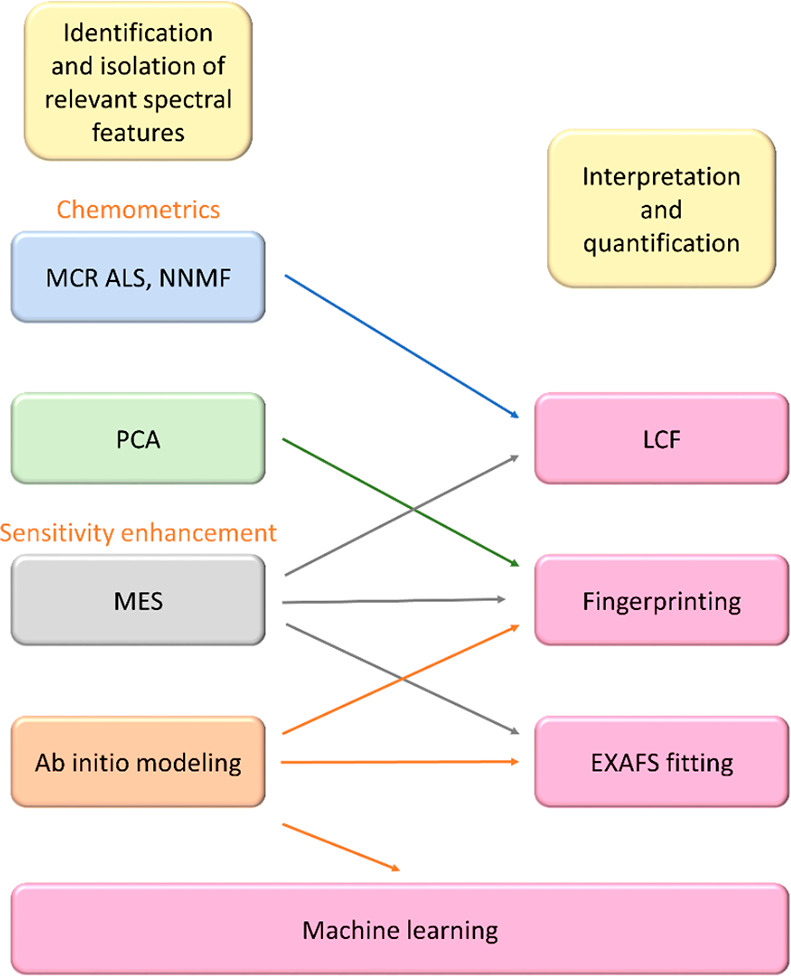
Different techniques involved in the data analysis of the X-ray spectroscopy is shown. Arrows show the data flow at various levels.

Different techniques involved in the data analysis of the X-ray spectroscopy is shown. Arrows show the data flow at various levels.