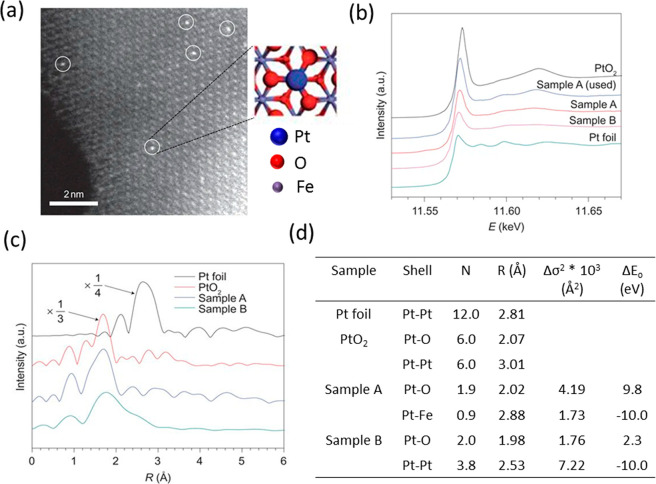
Figure 14.
(a) HAADF-STEM image of Pt1/FeOx, (b) XANES spectra of the catalyst at Pt L3-edge, (c) k3-weighted Fourier transformed EXAFS spectra of Pt1/FeOx, and (d) the EXAFS parameters derived from the fit. Sample A and B correspond to 0.17 and 2.5 wt % of Pt, respectively. The k-space considered was between 2.8 and 10.0 Å–1 for the samples and between 2.8 and 13.8 Å–1 for the reference Pt foil and oxide. The spectra were represented without phase correction. Adapted with permission from ref (20). Copyright 2011 Nature Publishing Group.

