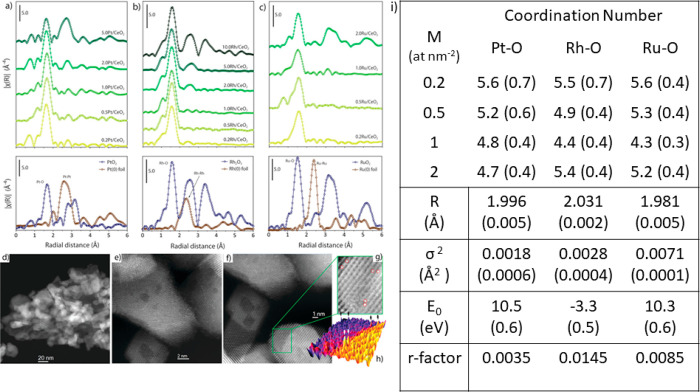
Figure 15.
FT k3-weighted EXAFS spectra of (a) Pt/CeO2, (b) Rh/CeO2, and (c) Ru/CeO2 together with the corresponding reference oxide and foil (without phase correction), (d–g) Cs HAADF-STEM micrograph of Pt/CeO2, (h) 3D map of the z-contrast of close-up view of (g) and (i) EXAFS free parameters obtained from fitting. The values in parentheses are errors from fitting. R, σ2, E0 and r represent the radial distance, Debye–Waller factor, energy shift and goodness of fit, respectively. Adapted with permission from reference (213) under creative Commons CC BY license.

