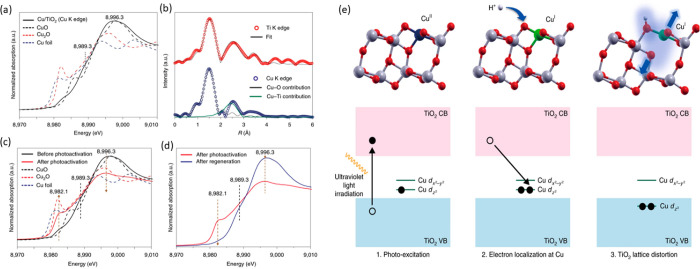
Figure 16.
(a) Normalized XANES spectra at the Cu K-edge of Cu1/TiO2, (b) radial distribution of Ti and Cu at their K-edges of Cu1/TiO2, (c) comparison of normalized XANES spectra at Cu K-edge before and after photoactivation, (d) comparison of normalized XANES spectra at Cu K-edge after photoactivation and regeneration, and (e) DFT-optimized structures of Cu1/TiO2 during photoactivation. Adapted with permission from ref (222). Copyright 2019 Nature Publishing Group.

