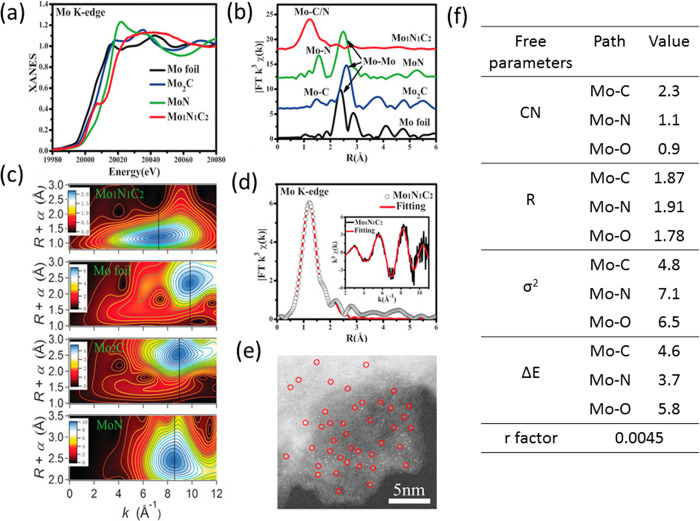
Figure 36.
(a) XANES and (b) FT k3-weighted EXAFS and (c) WT-EXAFS spectra of Mo1N1C2, MoN, Mo2C, and Mo foil at Mo K-edge, (d) experimental (open circles) and fitted curve (continuous red line) of Mo1N1C2, (e) HAADF-STEM image of Mo1N1C2 catalyst after catalytic test, and (f) free parameters derived from EXAFS fitting. The value of S02 was set as 0.85; k-range considered was between 2.0 and 10.5 Å–1. Mo–O scattering path represents the coordination of molecular oxygen to Mo center. Adapted with permission from ref (310). Copyright 2017 Wiley-VCH Verlag GmbH and Co. KGaA, Weinheim.

