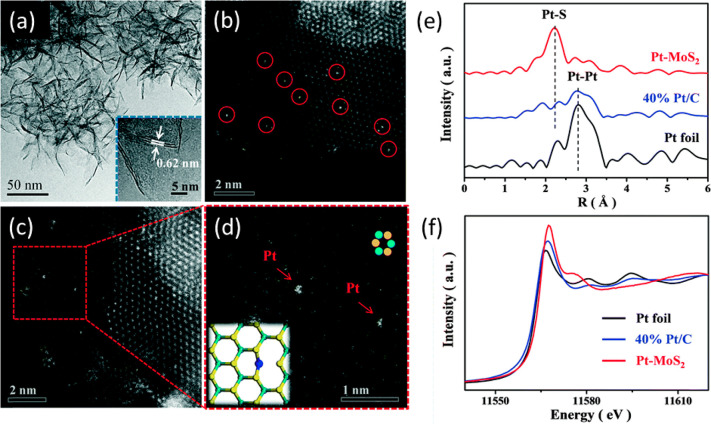
Figure 43.
(a) TEM image and (b–d) HAADF-STEM images of Pt1/MoS2 (red circles are representing the single Pt atoms), (e) FT k2-weighted EXAFS spectra of Pt1/MoS2, and (f) normalized XANES spectra of Pt1/MoS2 at the Pt L3-edge. Pt foil and 40 wt % Pt/C are shown as references. Adapted with permission from ref (334). Copyright Royal Society of Chemistry.

