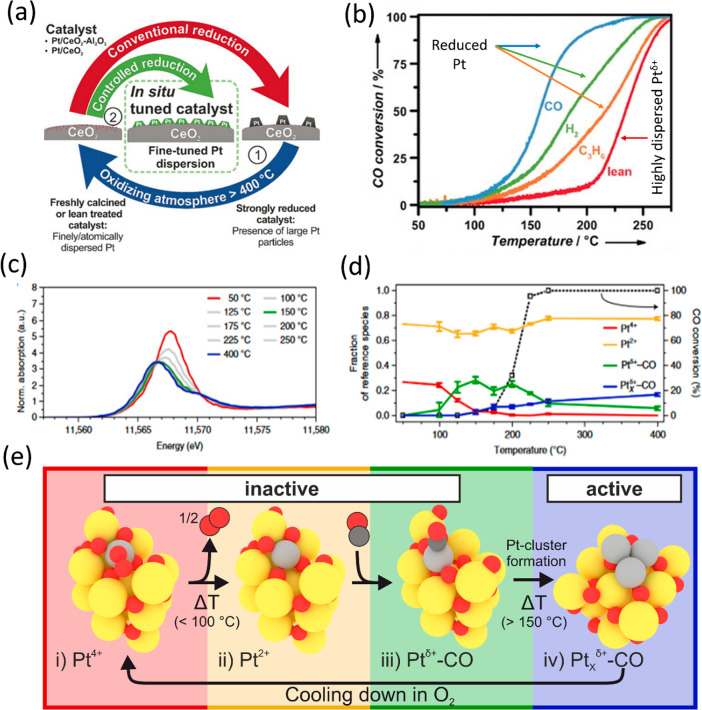
Figure 56.
(a) Schematic representation of the Pt state in CeO2 based catalysts depending on the pretreatment, (b) CO light-off curve after activation with different reductant (C3H8, H2 and CO), (c) HERFD-XANES of a Pt/CeO2 single catalyst at the Pt L3-edge under CO oxidation conditions and (d) corresponding linear combination analysis using references extracted by MCR-ALS together with CO conversion. (e) Scheme showing structural changes and evolution of Pt single sites during CO oxidation. Adapted with permission from refs (53 and 390). Copyright 2017 Wiley-VCH Verlag GmbH and Co. KGaA, Weinheim. Copyright 2020 The Author(s), under exclusive license to Springer Nature Limited.

