Figure 59.
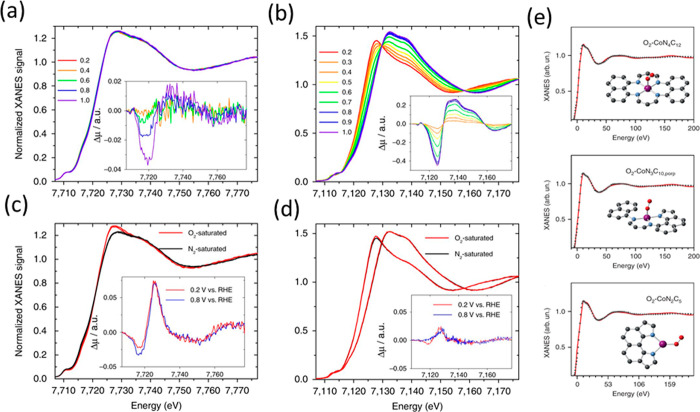
Normalized XANES spectra at different potential (a) at Co K-edge, (b) at Fe K-edge, (c) at Co K-edge in the presence of oxygen or nitrogen, (d) at Fe K-edge in the presence of oxygen or nitrogen, and (e) different model structures of Co–N–C material with O2 bounded to Co center with the corresponding fitting. The spectra were measured in the presence of 0.5 M H2SO4. Δμ spectra in (a) and (b) are obtained by subtracting normalized XANES spectra at every potential to the spectrum measured at 0.2 V potential versus RHE. Δμ spectra in (c) and (d) are obtained by subtracting normalized XANES spectra recorded in the presence of O2 to the one recorded in N2. Color code in (e): purple (cobalt), red (oxygen), blue (nitrogen), and gray (carbon). Adapted with permission from ref (401) under Creative Commons CC BY license http://creativecommons.org/licenses/by/4.0/.

