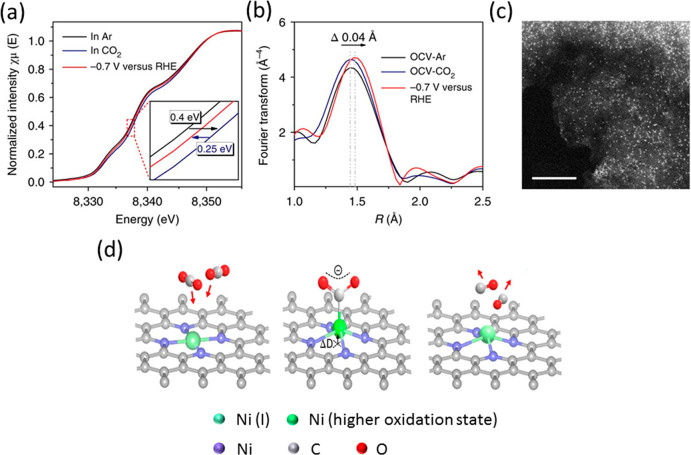
Figure 60.
(a) Normalized XANES spectra at Ni K-edge at different biases in an aqueous solution of 0.5 MKHCO3 at room temperature in the presence of 1 atm Argon or CO2. The enlarged spectra are shown in inset, (b) FT k3-weighted EXAFS spectra, (c) HAADF-STEM image of Ni1 supported on N-doped graphene, and (d) structural changes in the Ni atom during the CO2 reduction. ΔD is the displacement of Ni atom out of the plane when it binds to CO2 and forms a higher oxidation state due to charge transfer. The applied potential was −0.7 V versus RHE. The scale bar in the micrograph is 5 nm. Adapted with permission from ref (406). Copyright 2018, Springer Nature.

