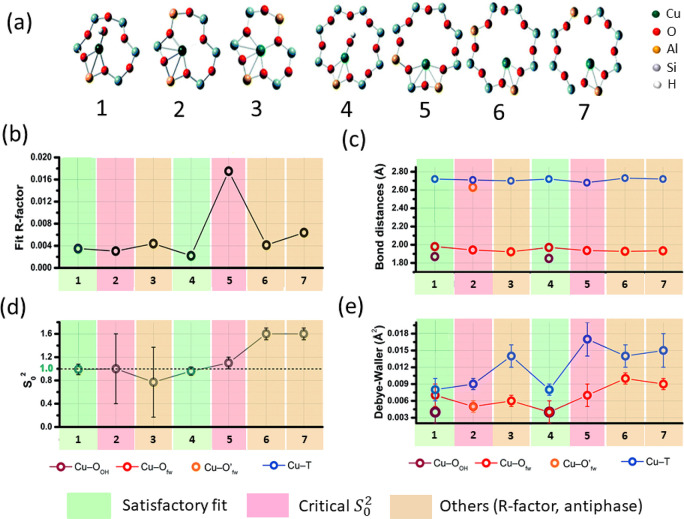
Figure 63.
Summary of fitting parameters obtained from EXAFS equation for isolated Cu (II) site in Cu-SSZ-13 with the DFT optimized model structures representing (a) model structures (b) goodness of fit R factor values, (c) average bond distance, (d) amplitude reduction factor S02, and (e) Debye–Waller factor. Different color code indicates the acceptability of the fit. The X-axis represents the number that corresponds to different model structures represented in (a). Adapted with permission from ref (421) under Creative Commons Attribution 3.0 Unported License.

