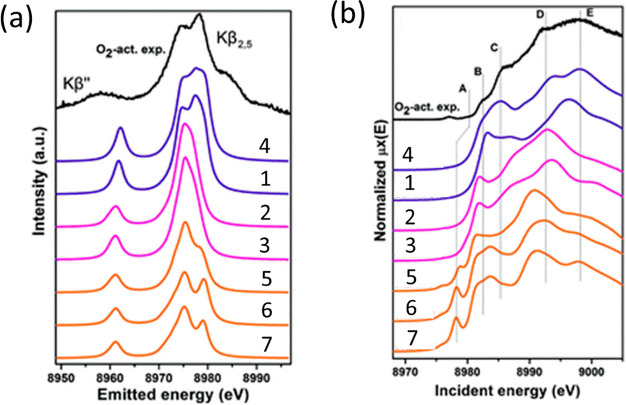
Figure 64.
Experimental (black curve) and simulated (a) XES and (b) HERFD-XANES spectra of different DFT optimized model structures at the Cu K-edge. The name corresponds to the same models shown in Figure 63. A, B, C, D, and E represents different features present in the experimental XANES spectra. Adapted with permission from ref (421) under Creative Commons Attribution 3.0 Unported License.

