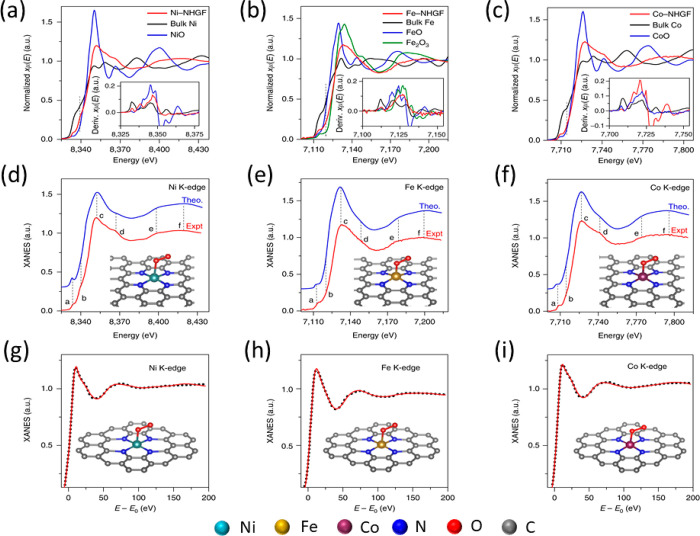
Figure 65.
(a–c) Experimental XANES spectra at the K-edge of Ni, Fe, and Co in the N-doped graphene framework together with the pure metal and oxide as reference, (d–f) comparison between the experimental and simulated XANES spectra, and (g–i) comparison between the experimental curve and the best fitted curve. Adapted with permission from ref (425). Copyright 2018, The Author(s).

