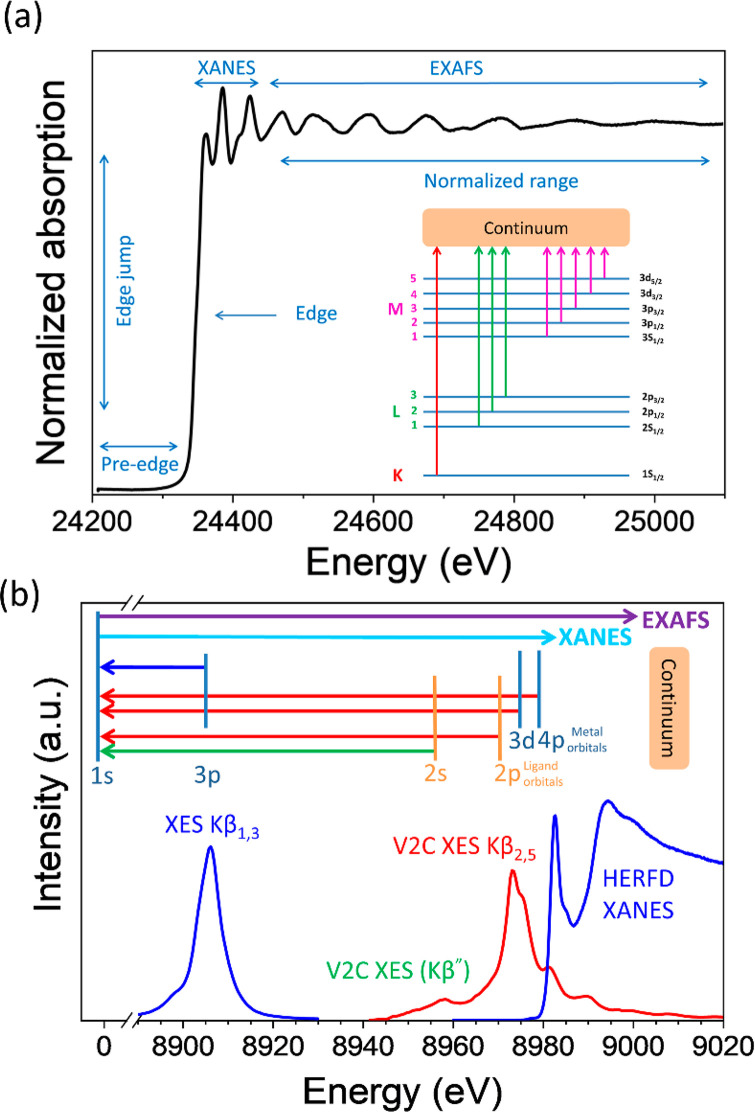
Figure 7.
Schematic representation of (a) XAS spectra of Pd foil at Pd K-edge with various features and electronic transitions giving rise to different absorption edges, (b) XES spectra at Cu K-edge with different electronic transitions and the corresponding features obtained from it (represented with the same color).

