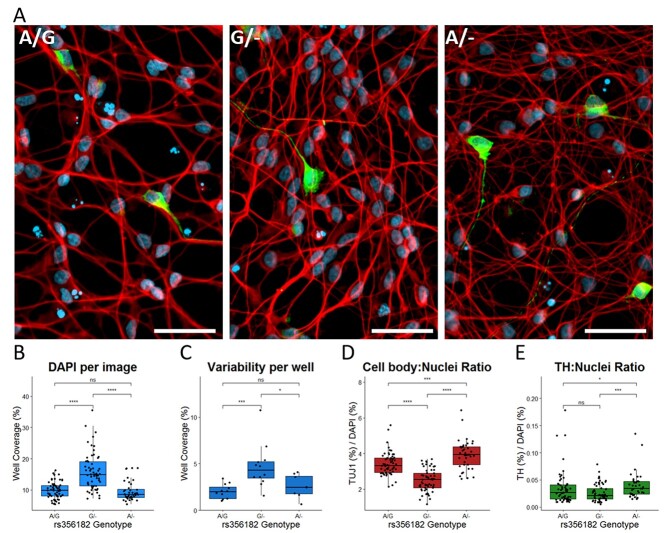
Figure 5.
The rs356182 risk-allele mediates a pathological morphology change. (A) Representative immunofluorescent images from wild-type A/G clones (left), risk G/− clones (middle) and protective A/− clones (right); white bar = 50 μm, blue = DAPI, red = TUJ1 and green = TH. (B–E) Quantification of immunofluorescent images by pixel coverage represented in box-and-whisker plots; Wilcoxon comparisons of non-parametric groups, ns: P > 0.05, *: P < =0.05, **: P < =0.01. ***: P < =0.001, ****: P < =0.0001. (B) DAPI coverage per image as a measure of cell density. (C) Standard deviation of inter-well DAPI coverage. (D) Ratio of TUJ1/DAPI as a relative measure of cell body to nucleus. (E) Ratio of TH/DAPI as a normalized measure of TH-expressing cells within the cell population.

